Int J Aging. 2024;2:e1.
doi: 10.34172/ija.2024.e1
Original Article
Aging Population in Vietnam: Challenges, Implications, and Policy Recommendations
Anika Maheshwari 1  , Greeni Maheshwari 2, *
Author information:
1Independent Researcher, Ho Chi Minh City, Vietnam
2RMIT University, Ho Chi Minh City, Vietnam
Abstract
Objectives:
This paper aimed to critically examine challenges of Vietnam in addressing its aging population, highlighting its status as the third fastest aging nation in ASEAN, after Singapore and Thailand. The primary goals are to grasp the impending demographic shift and offer recommendations for policymakers.
Design:
This study is a comprehensive review providing insights into the aging situation in Vietnam. It focused on short and long-term strategies to tackle challenges posed by the rapidly growing older adult population. It contextualized the aging issue in its socio-economic landscape. The review spanned 2020 to 2050, outlining the expected transformation in the population aged 65 years or above.
Setting(s):
The study has focused on Vietnam’s aging population by consolidating the secondary data sources.
Participants:
The study is a secondary data and hence various secondary sources have been used to analyze the data of this study.
Interventions:
There are no interventions used in this study.
Outcome measures:
Anticipated changes in the percentage of the population aged 65 years or above serve as outcome measures. This commentary projects an increase from nearly 7% in 2020 to 14% by 2035, tripling to 21% by 2050, indicating the magnitude of the aging challenge in Vietnam.
Results:
The present review proposes recommendations to address the aging issue, including boosting the skilled workforce, investing in technology and research and development (R&D), enhancing human capital, promoting international migration, creating additional funding opportunities, and introducing social protection measures. The results section encapsulates these suggested strategies as potential solutions to identified challenges.
Conclusions:
Vietnam faces a significant aging challenge with a rapid increase in the older adult population. This commentary advocates for a proactive approach by policymakers. The recommended strategies, both short and long-term, aim to mitigate economic and social challenges associated with an aging population. The conclusion stresses the importance of timely and effective policy measures to ensure sustainable development amid demographic changes in Vietnam.
Keywords: Ageing population, Economic, Social, Demographic, Productivity, Vietnam
Copyright and License Information
© 2024 The Author(s).
This is an open-access article distributed under the terms of the Creative Commons Attribution License (
https://creativecommons.org/licenses/by/4.0), which permits unrestricted use, distribution, and reproduction in any medium, provided the original work is properly cited.
Please cite this article as follows: Maheshwari A, Maheshwari G. Aging population in Vietnam: challenges, implications, and policy recommendations. Int J Aging. 2024;2: e1. doi: 10.34172/ija.2024.e1
Introduction
Vietnam, a Southeast Asian country, achieved middle-income status in the early 2010s, encountering challenges typical of such countries: declining fertility and mortality rates. According to the demographic transition model (DTM) in Figure 1, Vietnam currently resides in stage 3, marked by rapidly falling birth rates and decreasing death rates. This signifies a decline in the youth population and an increase in the old-age dependency ratio, a vital demographic indicator comparing the number of individuals aged 65 and above to the working-age population (15 to 64).
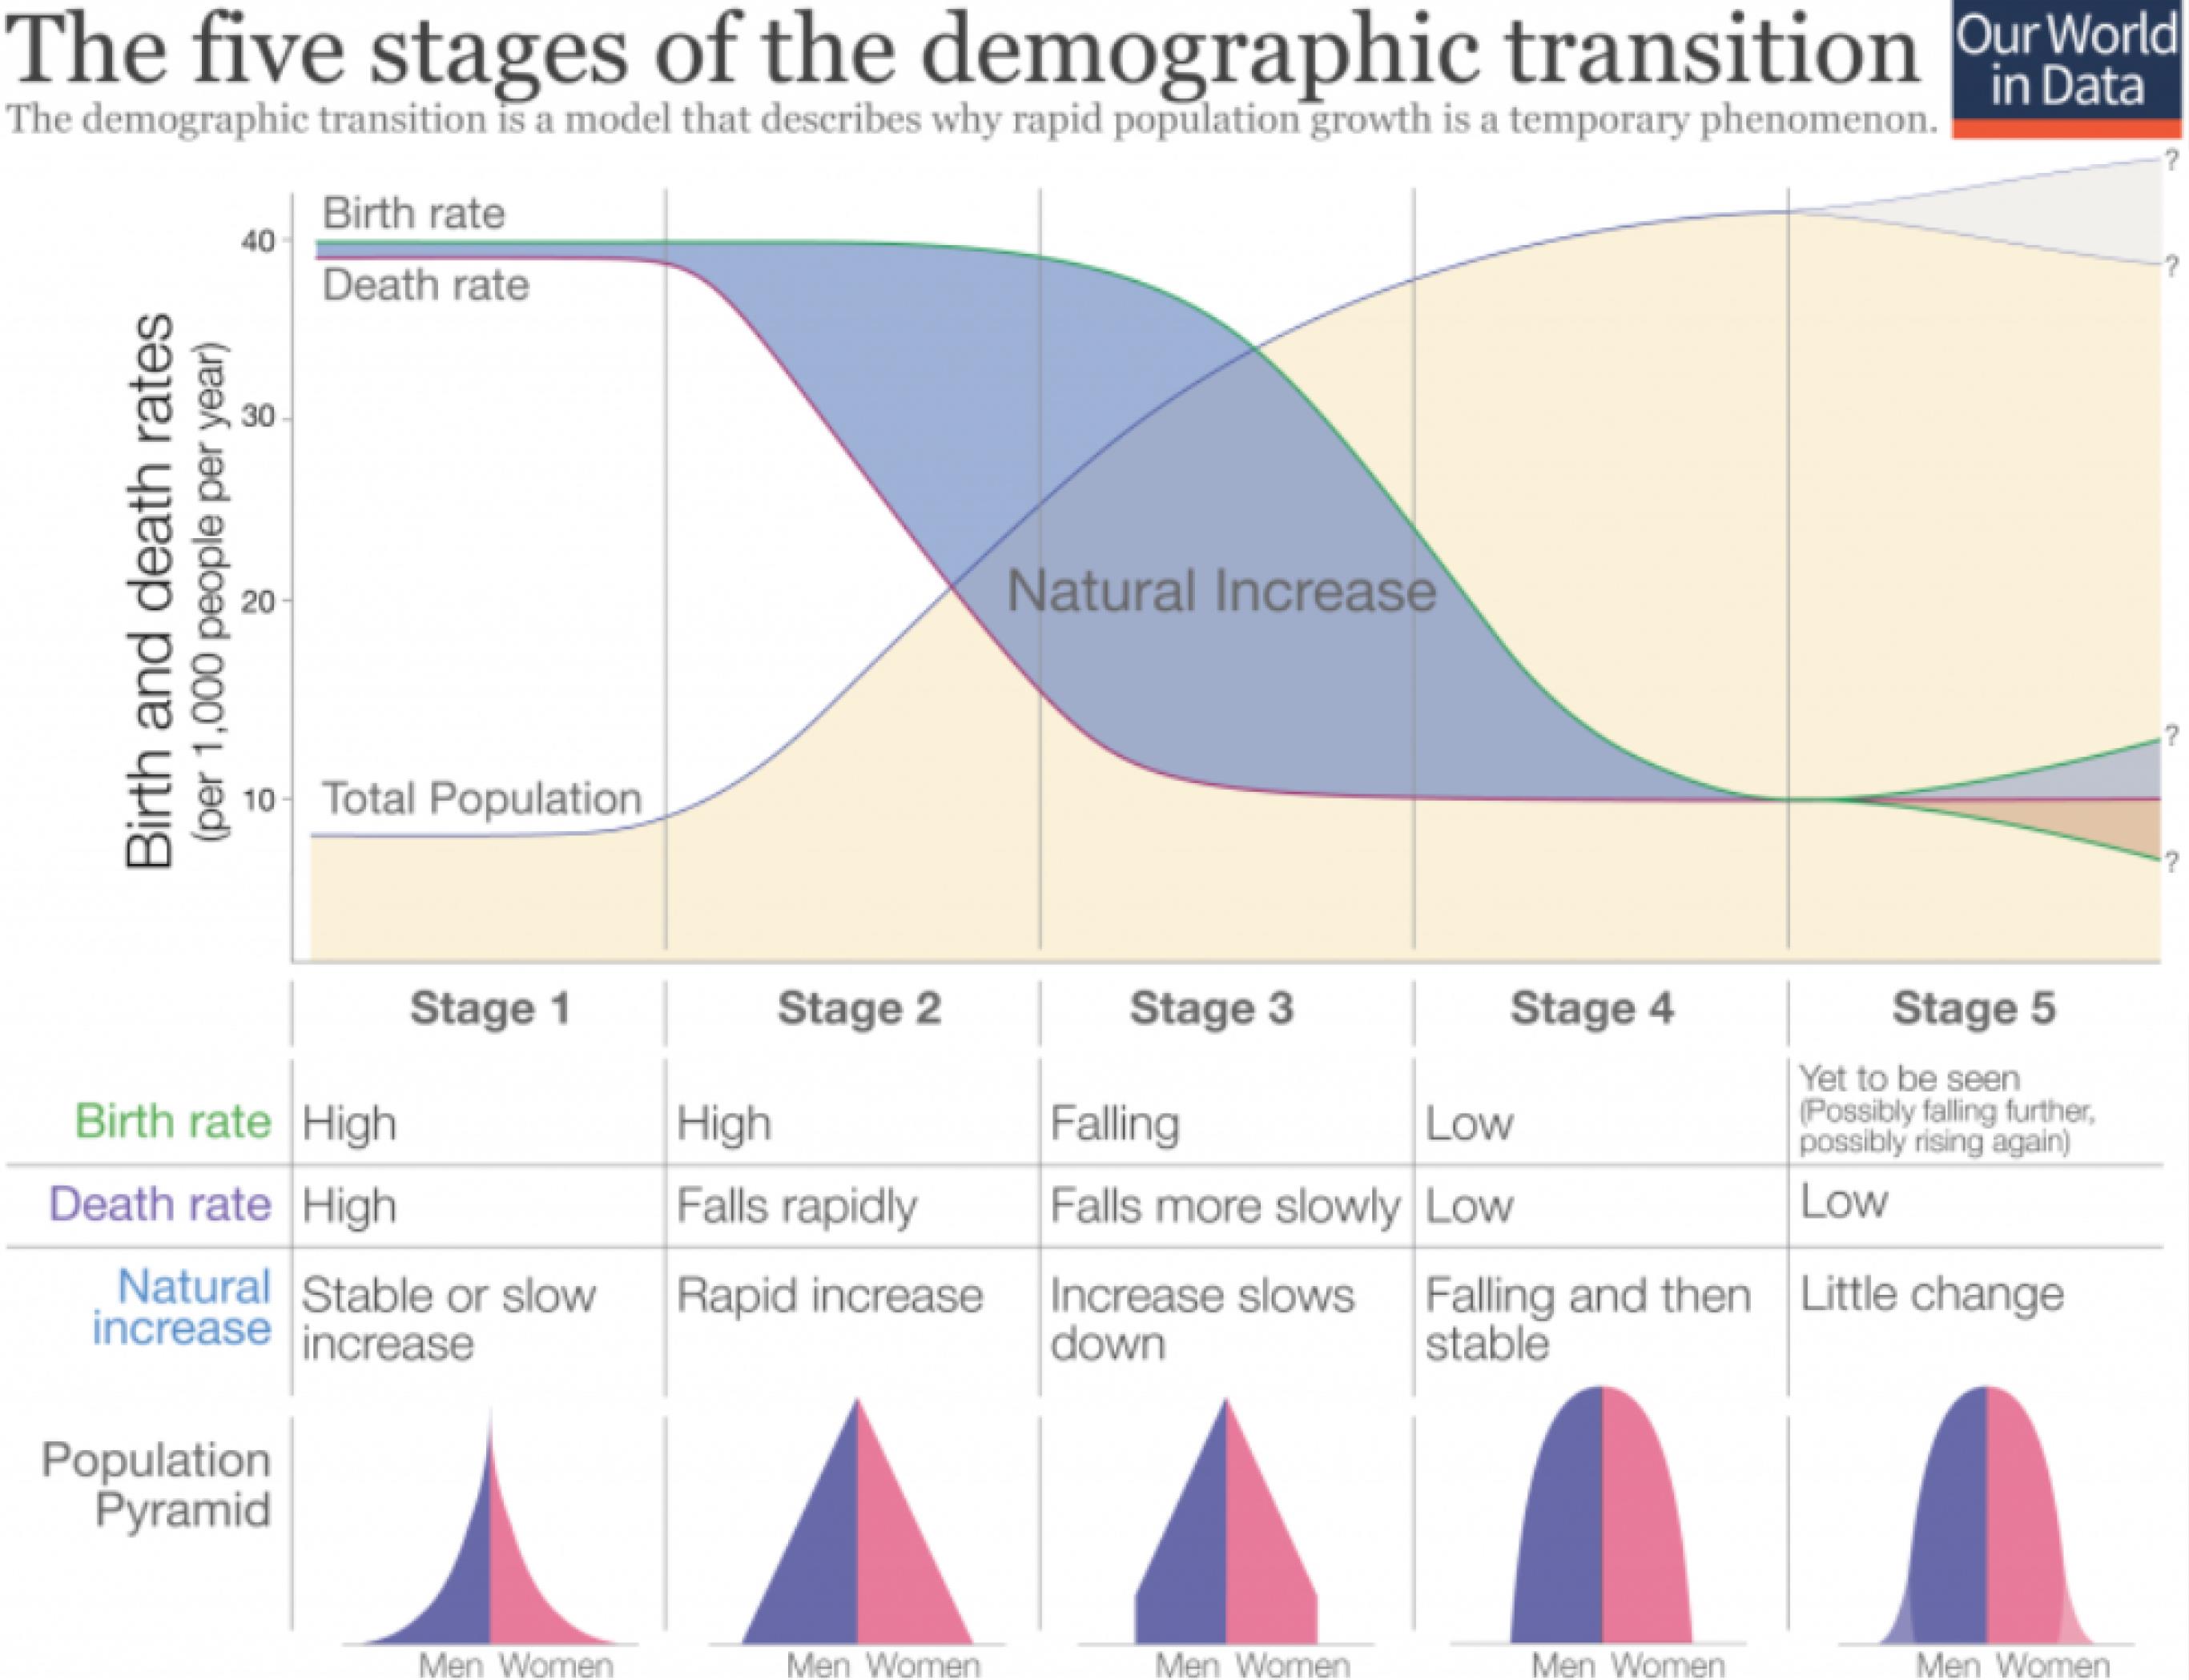
Figure 1.
Demographic Transition Model
.
Demographic Transition Model
A higher old-age dependency ratio implies a larger proportion of older adults relative to the working-age population, posing potential challenges to the economy and social support systems. This ratio reflects the economic burden on the working-age population, impacting resources for social welfare, healthcare, and pensions. Elevated ratios can strain government spending, leading to challenges such as labor shortages, increased healthcare costs, potential decreases in overall quality of life, and road safety issues.1
As Vietnam progresses into stage 4 of the DTM, the base of the population pyramid is expected to narrow due to low birth rates, resulting in a top-heavy structure with a broader top, as depicted in Figure 2 (2050 population pyramid). This shift indicates population aging, measured by the ratio of people above 65 years old to the total population, indicating the share of older individuals in society.2
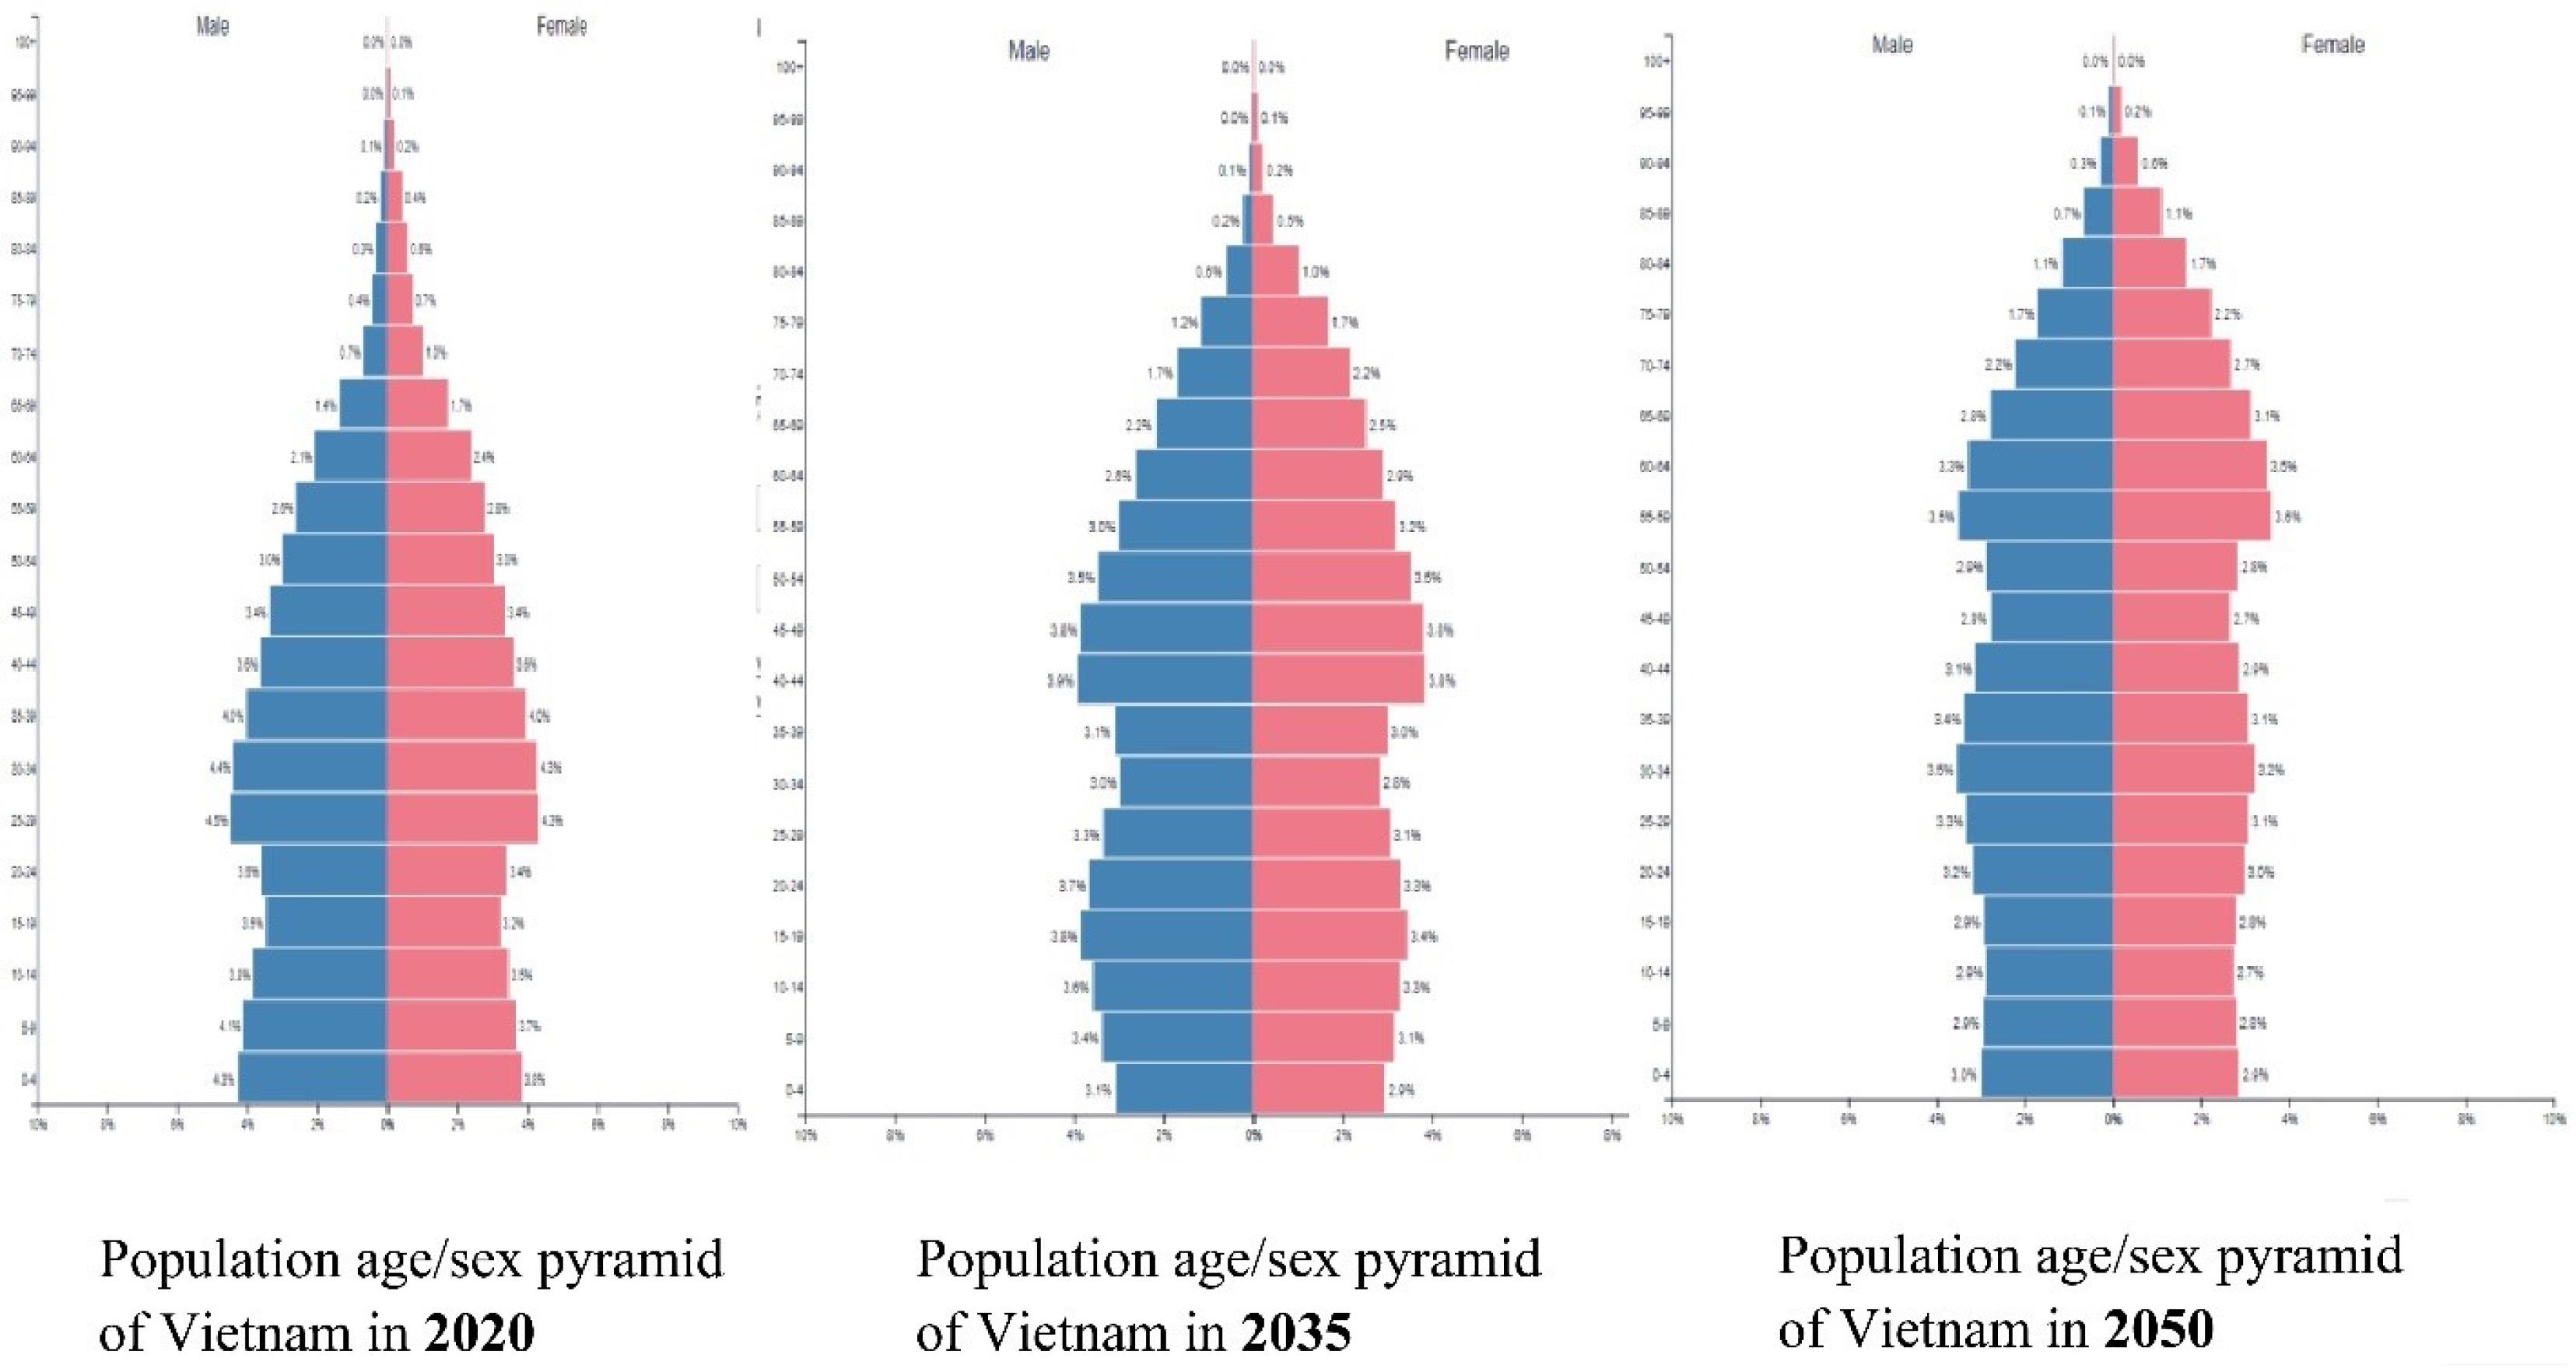
Figure 2.
Population Age/SexPyramid of Vietnam.11
.
Population Age/SexPyramid of Vietnam.11
The global population was 3.032 billion in 1960, increased to 7.762 billion by 2020 (as shown in Table 1), and is projected to reach 9.7 billion by 2050 and around 11 billion by 2100.3 The percentage of individuals below 14 years old has declined from 37.2% to 25.5% from 1960 to 2020, while the percentage of those aged 65 and above has risen from approximately 5% to 9.3% during the same period.
Table 1.
World Scenario (Population and Proportion of People of Different Age Groups)
|
|
Population (billion)
|
People Aged 0-14 Years Old (%)
|
People Aged 15-64 Years Old (%)
|
People Aged 65 Years or Above (%)
|
| 1960 |
3.032 |
37.17 |
57.86 |
4.97 |
| 1965 |
3.322 |
37.92 |
57.02 |
5.06 |
| 1970 |
3.681 |
37.55 |
57.15 |
5.30 |
| 1975 |
4.062 |
36.85 |
57.57 |
5.58 |
| 1980 |
4.433 |
35.33 |
58.78 |
5.89 |
| 1985 |
4.839 |
33.80 |
60.26 |
5.94 |
| 1990 |
5.280 |
32.86 |
60.98 |
6.16 |
| 1995 |
5.707 |
31.77 |
61.71 |
6.53 |
| 2000 |
6.114 |
30.16 |
62.97 |
6.87 |
| 2005 |
6.512 |
28.18 |
64.56 |
7.26 |
| 2010 |
6.922 |
27.02 |
65.42 |
7.57 |
| 2015 |
7.348 |
26.21 |
65.57 |
8.22 |
| 2020 |
7.762 |
25.48 |
65.20 |
9.32 |
Presently, approximately 9% of the global population is 65 years and older, and this figure is projected to rise to 16% by 2050, indicating that one in six individuals will be over 65.3 Research indicates that aging populations pose challenges to the fiscal and macroeconomic stability of numerous nations, given the increasing state expenditure on pensions, healthcare, and welfare programs for older adults.4,5 The reallocation of public funds from education and investments to support older population adversely impacts economic growth and overall quality of life.6 Therefore, implementing timely and effective policy measures becomes imperative to ensure macroeconomic and fiscal sustainability.7 As the population ages, governments must devise targeted policies for older individuals, encompassing healthcare, social protection measures, housing, and employment.8
Concerning Vietnam, a demographic shift in aging is anticipated, evident in the changing age composition illustrated by age/sex pyramids (Figure 2) for 2020 and projections for 2035 and 2050. Each bar in the pyramid represents the percentage of the population in 5-year intervals, with the bottom bar representing 0–4 years and the top bar representing 80 + years. The age distribution of males is shown on the left, and that of females is shown on the right. The pyramid indicates a rapid transformation from almost 7% to 14% of the population aged 65 years or above in just 15 years (from 2020 to 2035). This aging rate surpasses that of other developed countries, such as France (115 years), Sweden (85 years), Australia (73 years), the US (69 years), Canada (65 years), and the UK (45 years) 9. The “Squeezed Middle” by 2050, depicted in the population pyramid (Figure 2), suggests an almost three-fold increase in older people (21%) compared to 2020. Currently, Vietnam’s labor force constitutes 57% of the population, with significant employment in the manufacturing, services, and agriculture sectors.10 Future demographic shifts may lead to a substantial labor shortage, emerging as a primary concern for Vietnam.
While population aging is a global phenomenon observed in every country,12 Vietnam is undergoing this transformation at a pace faster than many developed nations. Consequently, it becomes imperative for the Vietnamese government to enact policies that address this issue and establish a new paradigm aligning with demographic aging to sustain economic and social growth. This commentary aimed to critically review the challenges posed by the aging population in Vietnam and offer recommendations for policymakers in addressing these challenges in the coming years. The subsequent sections are organized as follows: a global overview of aging, a specific examination of the aging scenario in Vietnam, an exploration of the consequences of aging in Vietnam, governmental responses to date, and finally, recommendations for policymakers. The review concludes with some closing remarks in the final section.
Global Scenario of Aging
Globally, a significant demographic transformation is underway, marked by a rise in the older population (65 years and above).6 The world’s median age is increasing due to declining fertility rates and extended life expectancy, contributing to a rapid aging of the population. The age structure may undergo further changes with sustained declines in fertility rates, increased life expectancy, and migration of younger populations. According to a previous report,3 the projected proportion of older adults (65 years or above) is anticipated to increase from 9.3% (as in Table 1) to approximately 12% by 2030, 16% by 2050, and 23% by 2100 (Table 2). In Latin America and the Caribbean region, the percentage of older individuals is expected to grow from 9% in 2019 to 19% in 2050. Conversely, South-eastern Asia projects an increase in the older population (65 years or above) from 11% in 2019 to 24% in 2050. Meanwhile, the Sub-Saharan region, having the youngest population, foresees an increase in the older adult population from 3% in 2019 to 5% in 2050 (Table 2). In 2019, Europe and Northern America had the highest proportion of older people (18%), followed by Australia and New Zealand with a proportion of 16% (Table 2). Projections indicate that one in every four people in Europe and Northern America will be above 65 years by 2050. Table 2 provides an overview of the proportion of people aged 65 or above in 2019, with projections for 2030, 2050, and 2100.
Table 2.
Percentage of Older Population (65 years and above) in the World and Different Regions
|
|
2019
|
2030
|
2050
|
2100
|
|
World
|
9.1
|
11.7
|
15.9
|
22.6
|
| Europe and Northern America |
18 |
22.1 |
26.1 |
29.3 |
| Latin America and Caribbean |
8.7 |
12 |
19 |
31.3 |
| Australia/New Zealand |
15.9 |
19.5 |
22.9 |
28.6 |
| Oceania |
4.2 |
5.3 |
7.7 |
15.4 |
| Central and Southern Asia |
6 |
8 |
13.1 |
25.7 |
| Eastern and South-Eastern Asia |
11.2 |
15.8 |
23.7 |
30.4 |
| Northern Africa and Western Africa |
5.7 |
7.6 |
12.7 |
22.4 |
| Sub-Saharan Africa |
3 |
3.3 |
4.8 |
13 |
Source: United Nations, Department of Economic and Social Affairs, Population Division.3
As of 2020, the latest available data in Asia (as in Table 3) indicates an average aging population proportion of around 7%. Among Asian regions, Central Asia exhibits the lowest aging population, averaging 5.2%, while Eastern Asia has an average aging population percentage of approximately 15.2%, followed by South-eastern Asia (7.1%). Western Asia and Southern Asia report average aging population percentages of 6.3% and 5.8%, respectively. Out of 45 Asian countries in 2020, 10 countries, including Japan, Korea, Georgia, Cyprus, Singapore, Thailand, Israel, China, Armenia, and Sri Lanka, recorded an older population proportion exceeding 10%. Conversely, the United Arab Emirates had the lowest percentage of older people in 2020 among all Asian countries (1.3%). Vietnam ranked 13th among 45 countries in 2020, with an older adult population percentage of 8%.
Table 3.
Percentage of Older Adult Population (65 Years and above) in Asian Countries
|
|
|
1960
|
1965
|
1970
|
1975
|
1980
|
1985
|
1990
|
1995
|
2000
|
2005
|
2010
|
2015
|
2020
|
| South-Eastern Asia |
Indonesia |
3.55 |
3.33 |
3.30 |
3.43 |
3.57 |
3.62 |
3.77 |
4.15 |
4.70 |
4.80 |
4.96 |
5.38 |
6.26 |
| South-Eastern Asia |
Philippines |
3.09 |
2.99 |
2.97 |
3.12 |
3.21 |
3.16 |
3.14 |
3.09 |
3.27 |
3.49 |
4.14 |
4.60 |
5.51 |
| South-Eastern Asia |
Vietnam |
4.72 |
4.98 |
5.39 |
4.94 |
5.34 |
5.50 |
5.74 |
5.95 |
6.42 |
6.54 |
6.49 |
6.66 |
7.87 |
| South-Eastern Asia |
Thailand |
3.31 |
3.43 |
3.50 |
3.58 |
3.75 |
3.98 |
4.52 |
5.47 |
6.53 |
7.75 |
8.90 |
10.60 |
12.96 |
| South-Eastern Asia |
Myanmar |
3.31 |
3.41 |
3.52 |
3.60 |
3.66 |
3.82 |
3.98 |
4.26 |
4.49 |
4.63 |
4.81 |
5.17 |
6.24 |
| South-Eastern Asia |
Malaysia |
3.42 |
3.20 |
3.31 |
3.57 |
3.59 |
3.70 |
3.68 |
3.81 |
3.92 |
4.42 |
4.94 |
5.98 |
7.18 |
| South-Eastern Asia |
Cambodia |
2.52 |
2.52 |
2.56 |
2.61 |
2.71 |
2.82 |
2.90 |
3.03 |
3.08 |
3.39 |
3.73 |
4.12 |
4.85 |
| South-Eastern Asia |
Lao PDR |
2.61 |
2.83 |
3.05 |
3.18 |
3.49 |
3.56 |
3.53 |
3.52 |
3.57 |
3.66 |
3.68 |
3.84 |
4.26 |
| South-Eastern Asia |
Singapore |
2.04 |
2.65 |
3.33 |
4.11 |
4.73 |
5.28 |
5.60 |
5.91 |
6.38 |
7.17 |
7.26 |
9.05 |
13.35 |
| South-Eastern Asia |
Timor-Leste |
2.50 |
2.46 |
2.63 |
2.64 |
2.68 |
2.88 |
3.05 |
3.20 |
3.41 |
3.71 |
4.04 |
4.39 |
4.28 |
| South-Eastern Asia |
Brunei |
3.88 |
3.69 |
3.53 |
3.49 |
2.82 |
2.79 |
2.61 |
2.62 |
2.37 |
2.95 |
3.39 |
4.07 |
5.57 |
| Southern Asia |
India |
3.05 |
3.22 |
3.30 |
3.48 |
3.61 |
3.71 |
3.80 |
4.03 |
4.37 |
4.74 |
5.08 |
5.61 |
6.57 |
| Southern Asia |
Pakistan |
4.32 |
3.94 |
3.81 |
3.79 |
3.84 |
3.87 |
3.90 |
3.95 |
4.00 |
4.10 |
4.24 |
4.31 |
4.35 |
| Southern Asia |
Bangladesh |
2.69 |
2.67 |
2.77 |
3.05 |
3.09 |
3.03 |
3.14 |
3.38 |
3.85 |
4.30 |
4.77 |
5.10 |
5.23 |
| Southern Asia |
Iran |
4.01 |
3.52 |
3.31 |
3.18 |
2.96 |
2.87 |
3.29 |
3.81 |
4.38 |
4.76 |
5.15 |
5.81 |
6.56 |
| Southern Asia |
Afghanistan |
2.80 |
2.71 |
2.63 |
2.55 |
2.43 |
2.24 |
2.23 |
2.37 |
2.29 |
2.23 |
2.33 |
2.48 |
2.65 |
| Southern Asia |
Nepal |
2.54 |
2.72 |
2.94 |
3.15 |
3.29 |
3.40 |
3.53 |
3.63 |
3.77 |
4.30 |
5.01 |
5.54 |
5.83 |
| Southern Asia |
Sri Lanka |
4.52 |
3.80 |
3.68 |
3.96 |
4.36 |
4.88 |
5.47 |
6.05 |
6.22 |
6.84 |
7.43 |
9.39 |
11.23 |
| Southern Asia |
Bhutan |
2.36 |
2.35 |
2.35 |
2.39 |
2.47 |
2.63 |
2.83 |
3.49 |
3.92 |
4.41 |
5.14 |
5.74 |
6.20 |
| Southern Asia |
Maldives |
2.58 |
2.42 |
2.34 |
2.35 |
2.53 |
2.62 |
2.79 |
3.06 |
3.76 |
4.43 |
4.56 |
3.94 |
3.59 |
| Eastern Asia |
China |
3.69 |
3.42 |
3.75 |
4.08 |
4.67 |
5.31 |
5.63 |
6.12 |
6.81 |
7.48 |
8.07 |
9.33 |
11.97 |
| Eastern Asia |
Japan |
5.62 |
6.17 |
6.88 |
7.70 |
8.91 |
10.11 |
11.87 |
14.30 |
16.98 |
19.65 |
22.50 |
26.02 |
28.40 |
| Eastern Asia |
Korea, Rep. |
3.37 |
3.47 |
3.44 |
3.77 |
4.12 |
4.48 |
5.23 |
5.98 |
7.19 |
8.86 |
10.69 |
12.86 |
15.79 |
| Eastern Asia |
Mongolia |
4.83 |
4.92 |
4.79 |
4.87 |
4.49 |
4.34 |
4.13 |
3.80 |
3.69 |
3.72 |
3.80 |
3.86 |
4.31 |
| Western Asia |
Turkey |
3.19 |
3.72 |
3.99 |
4.47 |
4.72 |
4.43 |
4.61 |
5.21 |
6.09 |
6.68 |
7.21 |
7.87 |
8.98 |
| Western Asia |
Iraq |
3.11 |
3.64 |
4.01 |
4.16 |
4.09 |
4.02 |
3.83 |
3.60 |
3.48 |
3.38 |
3.36 |
3.10 |
3.44 |
| Western Asia |
Saudi Arabia |
3.62 |
3.56 |
3.44 |
3.26 |
3.02 |
2.63 |
2.82 |
2.91 |
3.00 |
2.96 |
2.97 |
3.02 |
3.50 |
| Western Asia |
Yemen, Rep. |
3.71 |
3.56 |
3.41 |
3.26 |
3.02 |
2.77 |
2.53 |
3.05 |
2.78 |
2.67 |
2.66 |
2.80 |
2.93 |
| Western Asia |
Syria |
4.00 |
3.65 |
3.33 |
3.11 |
2.96 |
2.90 |
3.02 |
3.18 |
3.34 |
3.35 |
3.41 |
3.99 |
4.87 |
| Western Asia |
Jordan |
4.26 |
3.72 |
3.25 |
3.03 |
3.18 |
3.53 |
3.20 |
2.92 |
3.06 |
3.35 |
3.63 |
3.76 |
3.95 |
| Western Asia |
Azerbaijan |
5.38 |
5.12 |
5.19 |
5.11 |
5.08 |
4.65 |
4.64 |
5.31 |
5.85 |
6.59 |
5.90 |
5.74 |
6.74 |
| Western Asia |
United Arab Emirates |
3.43 |
2.29 |
1.44 |
1.49 |
1.45 |
1.22 |
1.20 |
1.05 |
1.09 |
0.89 |
0.69 |
0.93 |
1.26 |
| Western Asia |
Israel |
4.65 |
5.55 |
6.48 |
7.67 |
8.66 |
8.62 |
8.93 |
9.77 |
10.03 |
10.02 |
10.45 |
11.23 |
12.41 |
| Western Asia |
Lebanon |
5.95 |
5.28 |
5.05 |
4.93 |
5.44 |
5.12 |
5.26 |
5.17 |
5.70 |
5.94 |
6.36 |
6.33 |
7.55 |
| Western Asia |
Oman |
2.99 |
3.11 |
3.18 |
3.06 |
2.73 |
2.42 |
2.29 |
2.07 |
2.43 |
2.59 |
2.69 |
2.28 |
2.51 |
| Western Asia |
Kuwait |
2.00 |
1.67 |
1.86 |
1.73 |
1.63 |
1.36 |
1.33 |
1.36 |
1.58 |
2.16 |
2.00 |
2.12 |
3.04 |
| Western Asia |
Georgia |
8.64 |
7.67 |
7.74 |
8.41 |
9.25 |
8.88 |
9.31 |
11.52 |
12.93 |
14.48 |
14.24 |
14.35 |
15.25 |
| Western Asia |
Armenia |
6.35 |
5.43 |
5.56 |
5.80 |
5.96 |
5.41 |
5.63 |
8.38 |
10.02 |
11.90 |
10.99 |
10.88 |
11.80 |
| Western Asia |
Qatar |
2.94 |
2.40 |
2.01 |
2.13 |
1.58 |
1.30 |
1.31 |
1.44 |
1.74 |
1.30 |
0.71 |
1.00 |
1.69 |
| Western Asia |
Bahrain |
2.99 |
1.79 |
2.50 |
2.41 |
2.06 |
2.63 |
2.18 |
2.40 |
2.45 |
2.24 |
2.08 |
2.32 |
2.65 |
| Western Asia |
Cyprus |
5.90 |
6.48 |
10.07 |
9.72 |
9.35 |
9.84 |
9.91 |
10.12 |
10.23 |
10.77 |
11.42 |
12.83 |
14.41 |
| Central Asia |
Uzbekistan |
5.92 |
6.03 |
5.93 |
5.69 |
5.16 |
4.49 |
4.11 |
4.45 |
4.62 |
4.84 |
4.51 |
4.06 |
4.79 |
| Central Asia |
Kazakhstan |
5.70 |
5.21 |
5.39 |
5.67 |
6.11 |
5.68 |
5.86 |
7.19 |
6.84 |
7.69 |
6.81 |
6.76 |
7.90 |
| Central Asia |
Tajikistan |
4.78 |
4.86 |
5.08 |
4.73 |
4.60 |
4.02 |
3.84 |
3.86 |
3.60 |
3.80 |
3.30 |
2.94 |
3.18 |
| Central Asia |
Turkmenistan |
5.20 |
4.67 |
4.65 |
4.46 |
4.25 |
3.87 |
3.77 |
4.10 |
4.28 |
4.59 |
4.14 |
4.07 |
4.77 |
Scenario of Aging in Vietnam
Vietnam has experienced a notable decline in fertility rates, dropping from 4.2 births per woman in 1985 to 2.1 in 2020 (Figure 3).13 This decline coincided with the market-based economic reforms implemented in 1986. Additionally, life expectancy in Vietnam has exhibited a positive trend, rising from 59 to 79.4 years between 1960 and 202013 as illustrated in Figure 3.
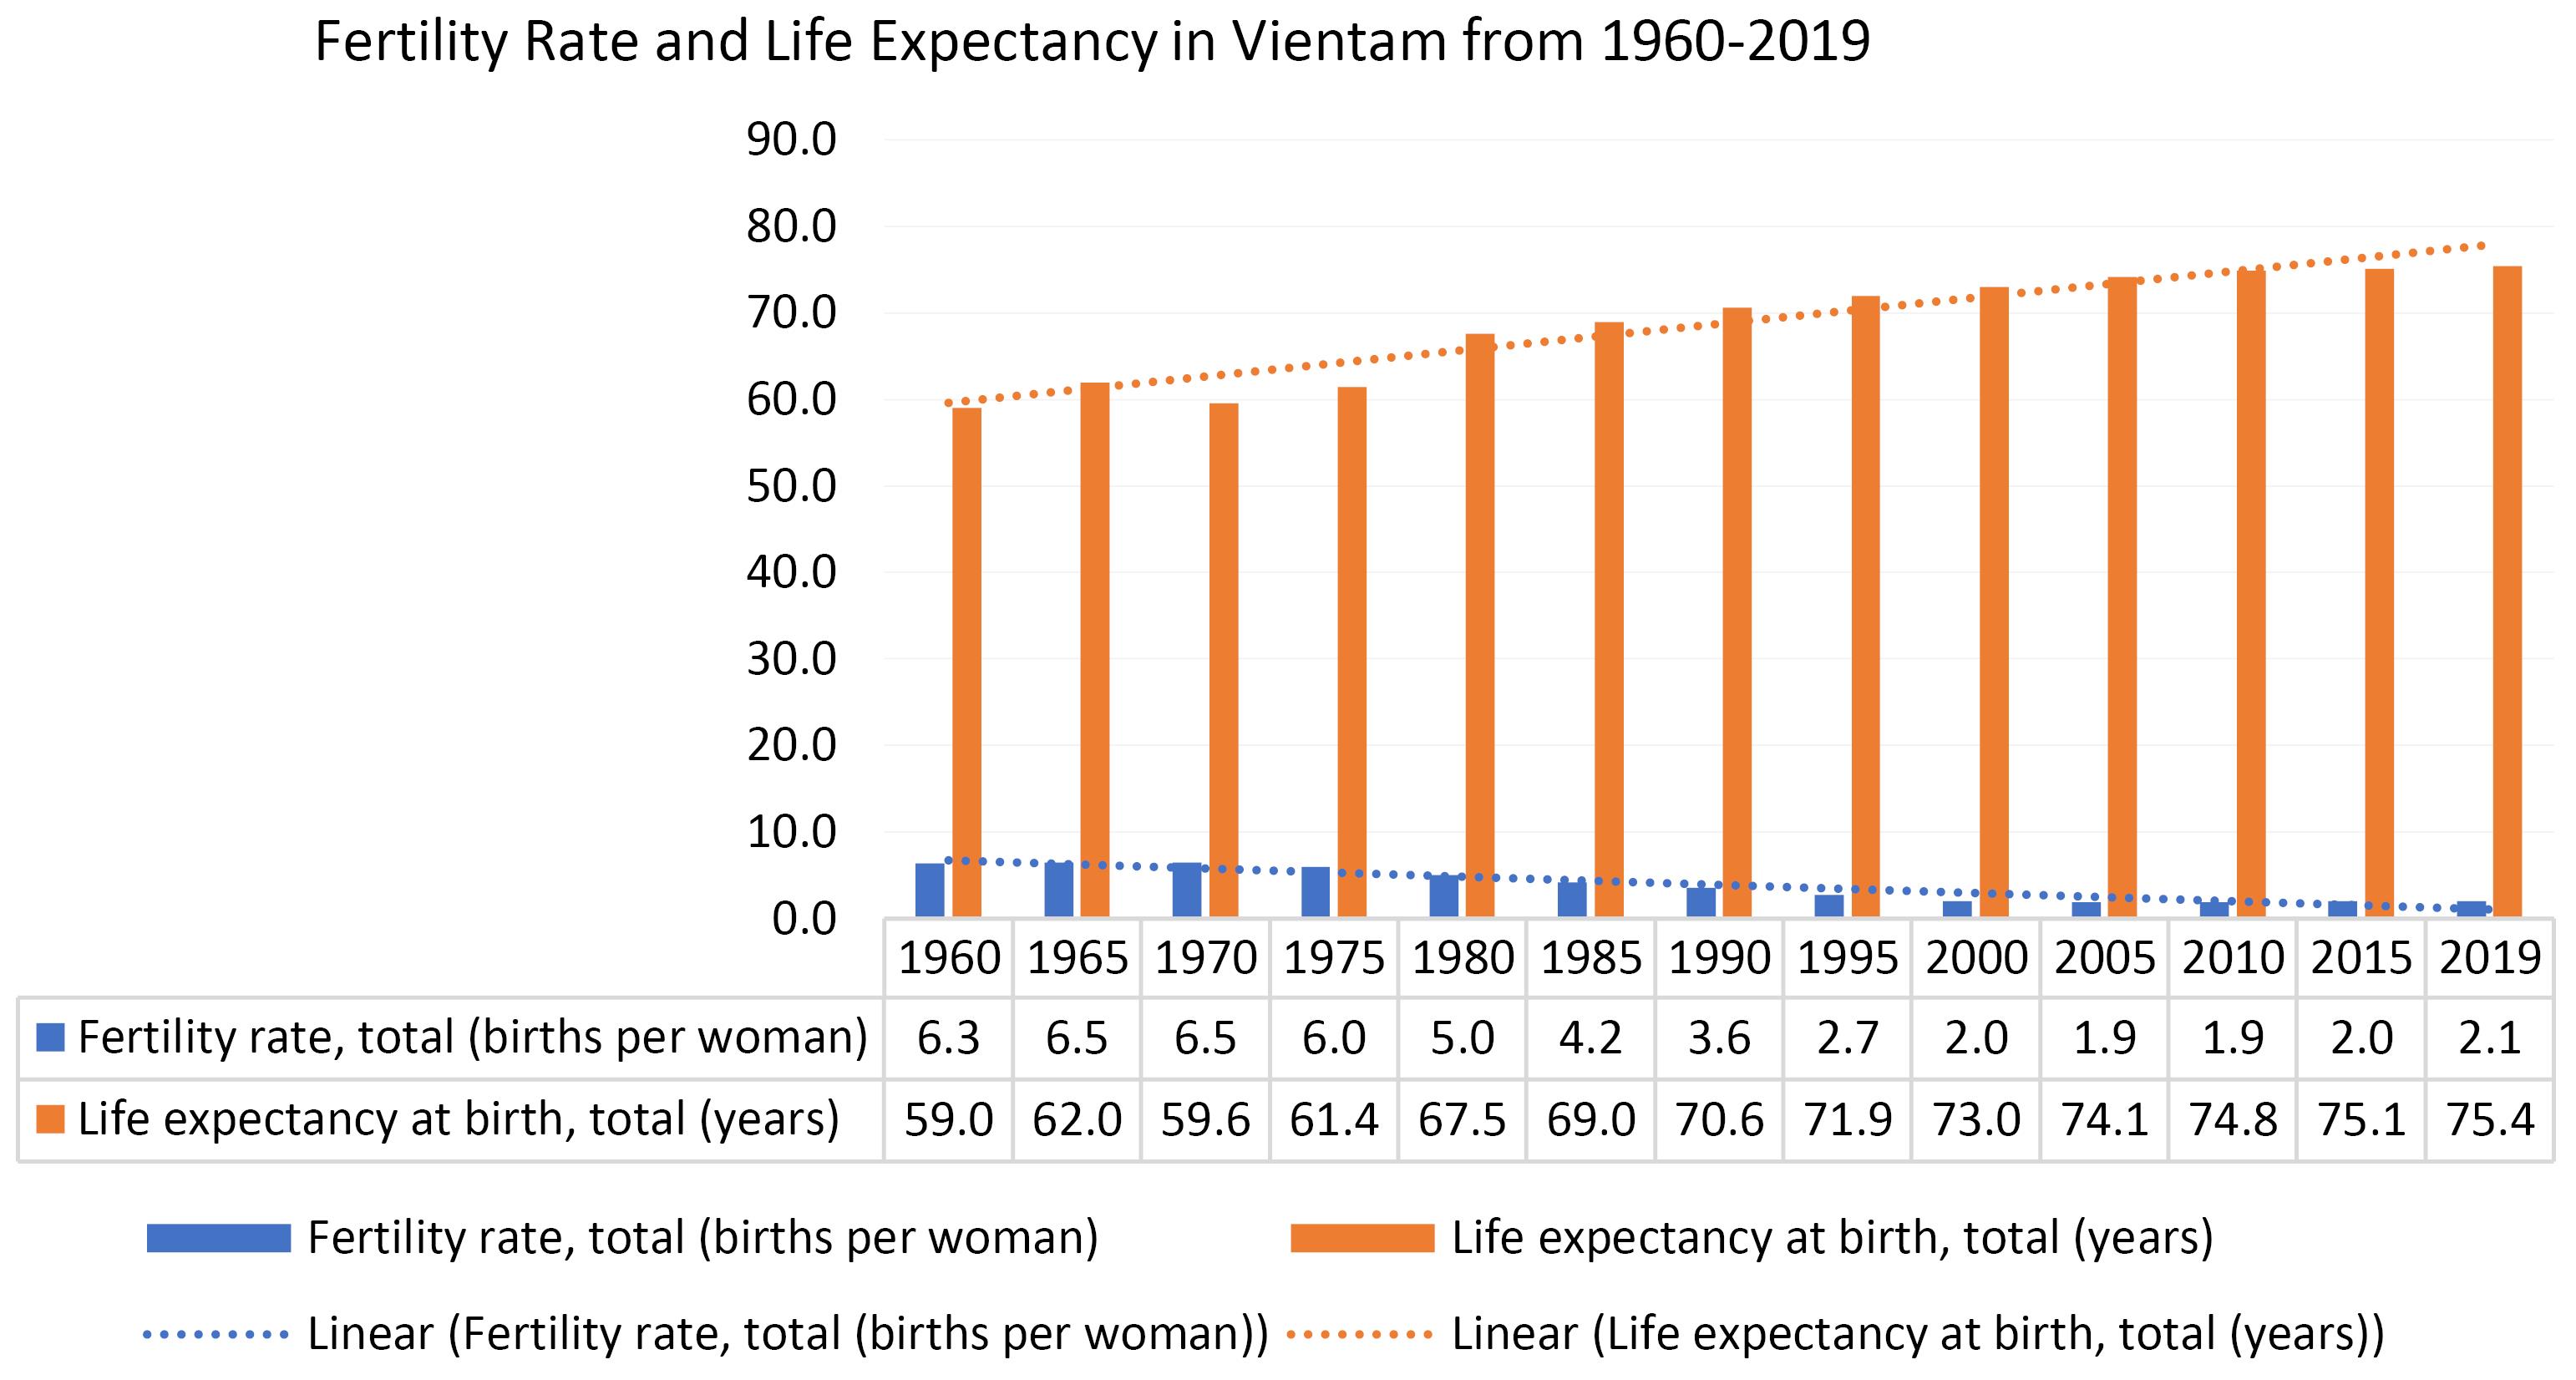
Figure 3.
Fertility Rate and Life Expectancy in Vietnam.13
.
Fertility Rate and Life Expectancy in Vietnam.13
The data analysis for this study involved the compilation of results from various websites and research papers, without using any specific method. Examining data from 1960 to 2020 in Vietnam reveals significant demographic shifts. The proportion of children aged 0–14 has decreased from 40.1% to 23.2%, while the percentage of the working-age population has declined from 81.3% to 45.1%. Concurrently, the aging population has increased from 4.7% to 7.9% over the past six decades (Figure 4). According to a previous study,13 Vietnam turned into an aging society in 2015 and is projected to become an aged society by 2035, making it one of the fastest-aging countries globally. The experts suggest that the aging population in Vietnam will increase in the coming decades. Vietnam is projected to exit from the “golden population structure” within the next 20 years, raising concerns about the prospect of Vietnamese people “getting old before becoming rich”.14
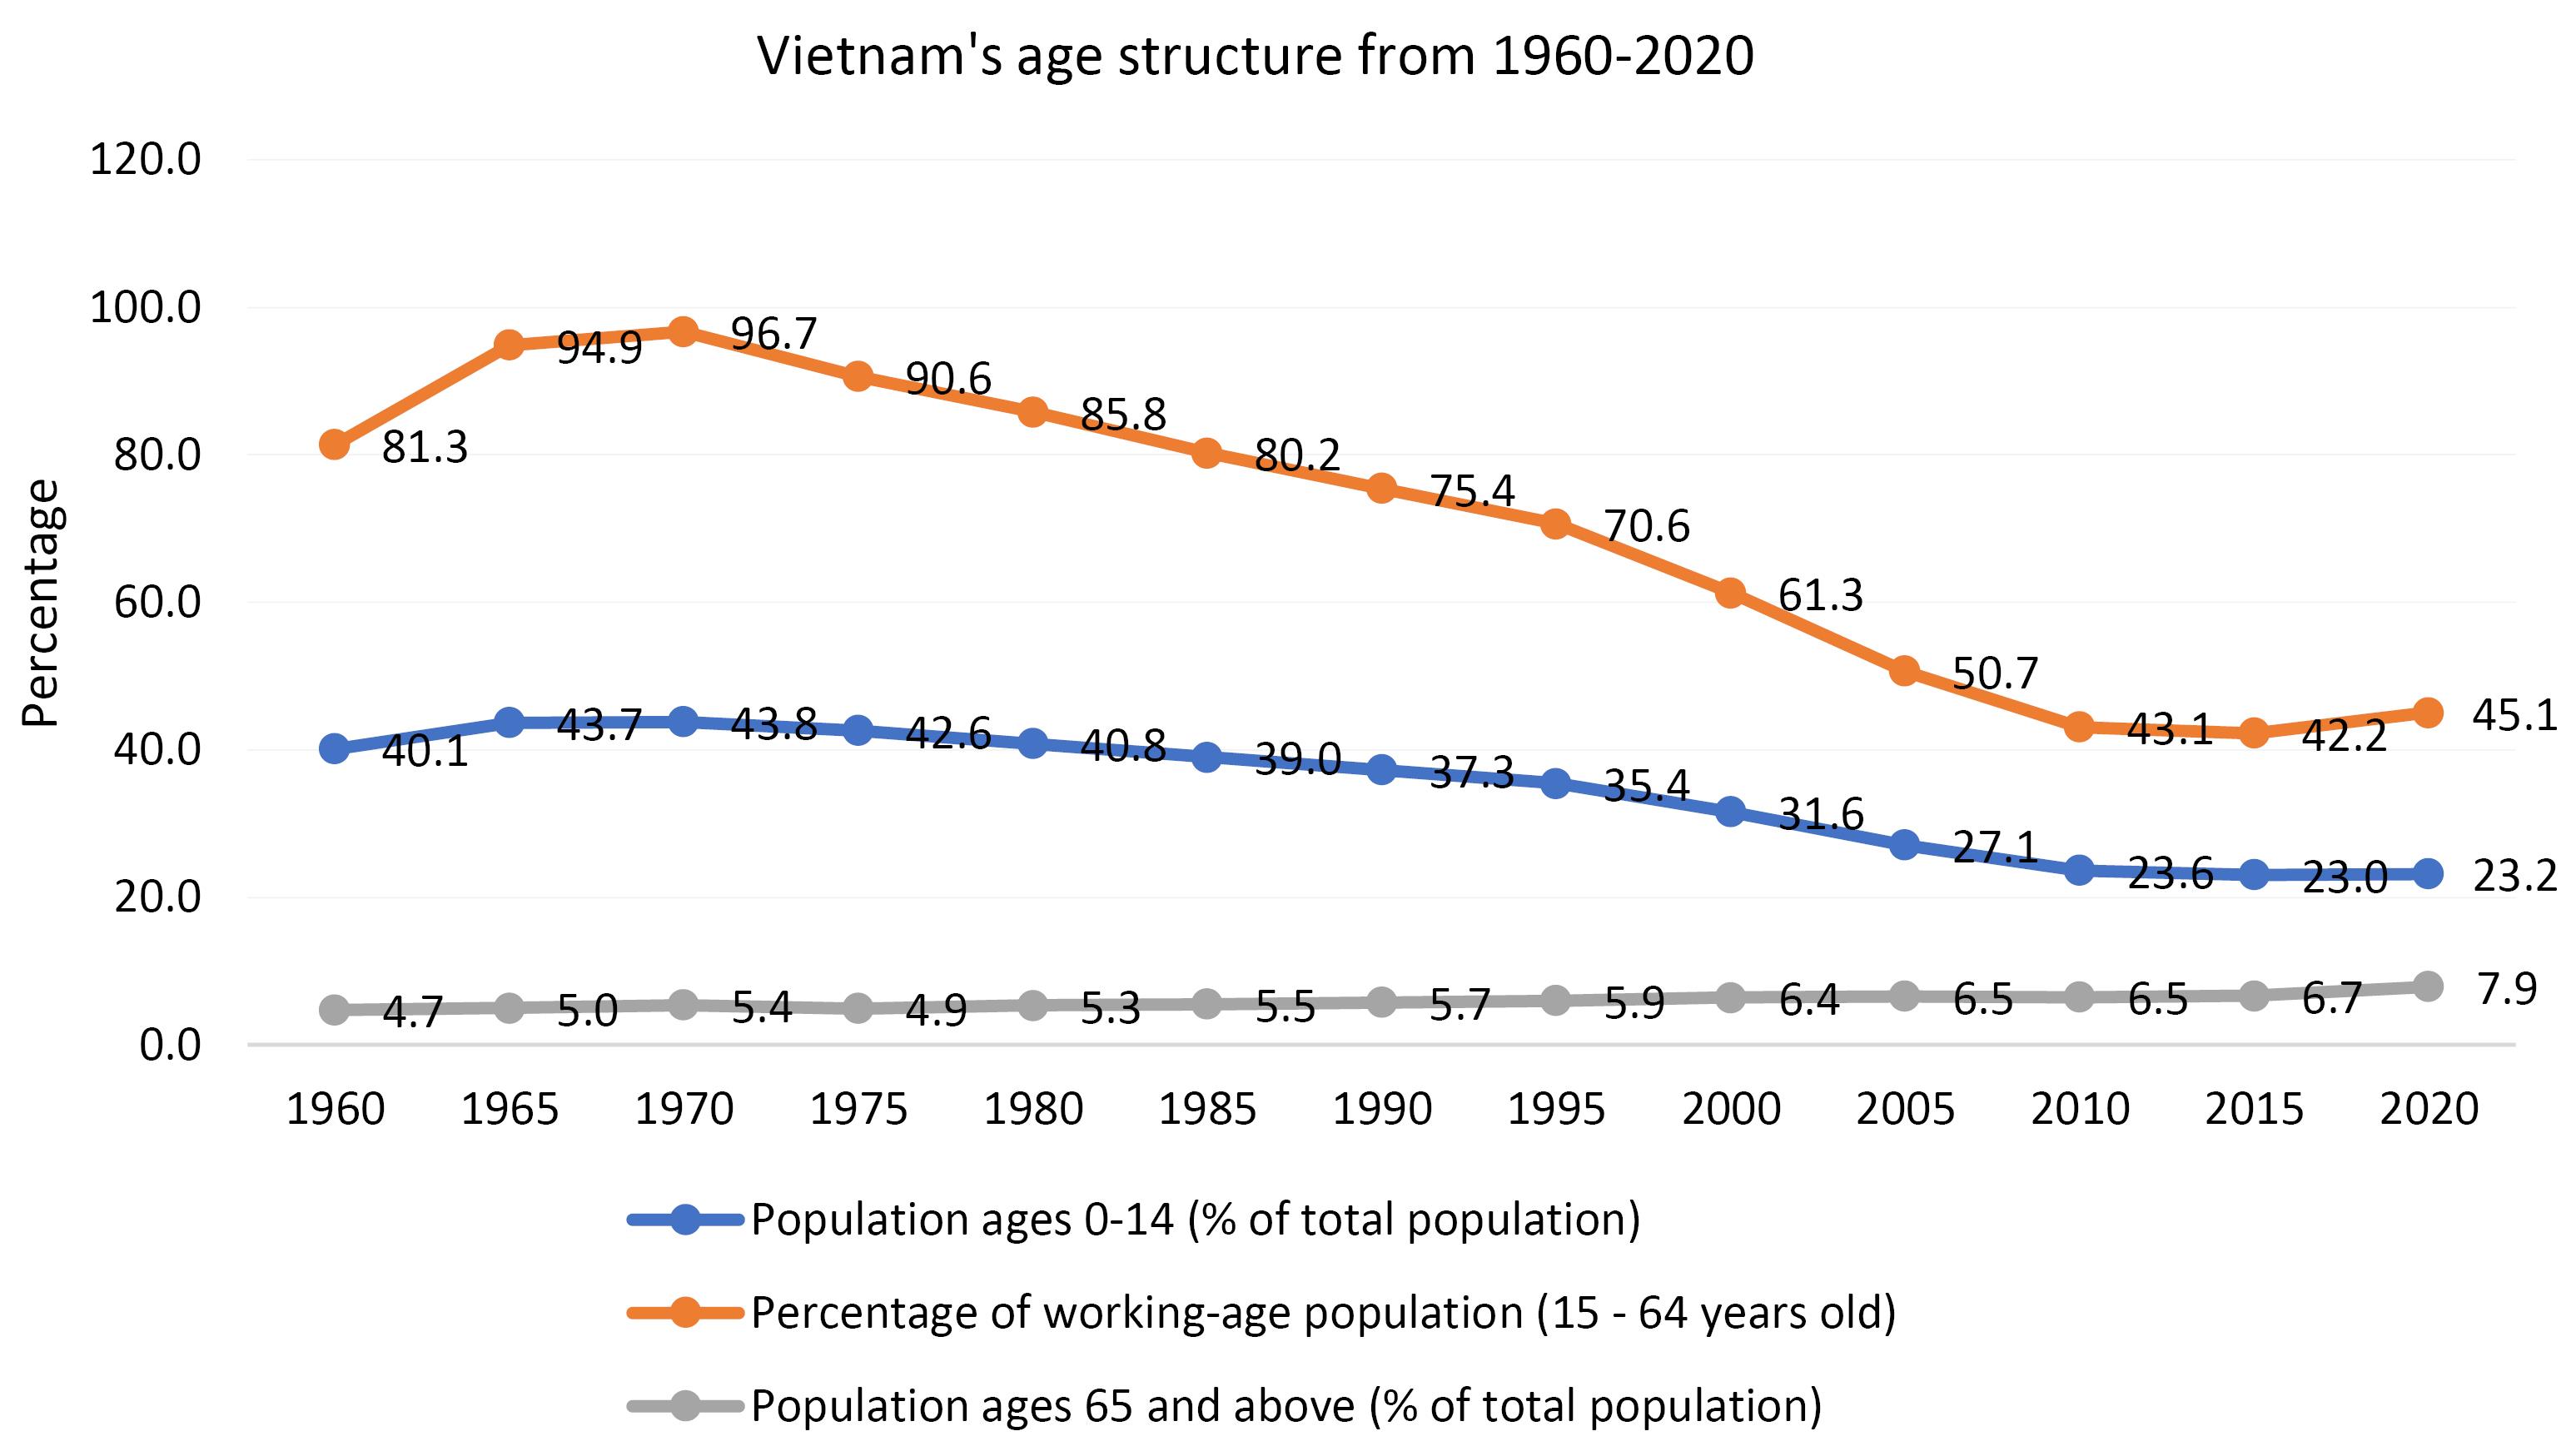
Figure 4.
Age Structure in Vietnam.13
.
Age Structure in Vietnam.13
According to the latest available data for 2020, the median age of Vietnam’s population is 32.5 years, which is projected to increase to 41.2 years by 2050.15 Figure 5 illustrates the changes in the median age, showing a steady rise, reaching 41.2 years in the projection for 2050.
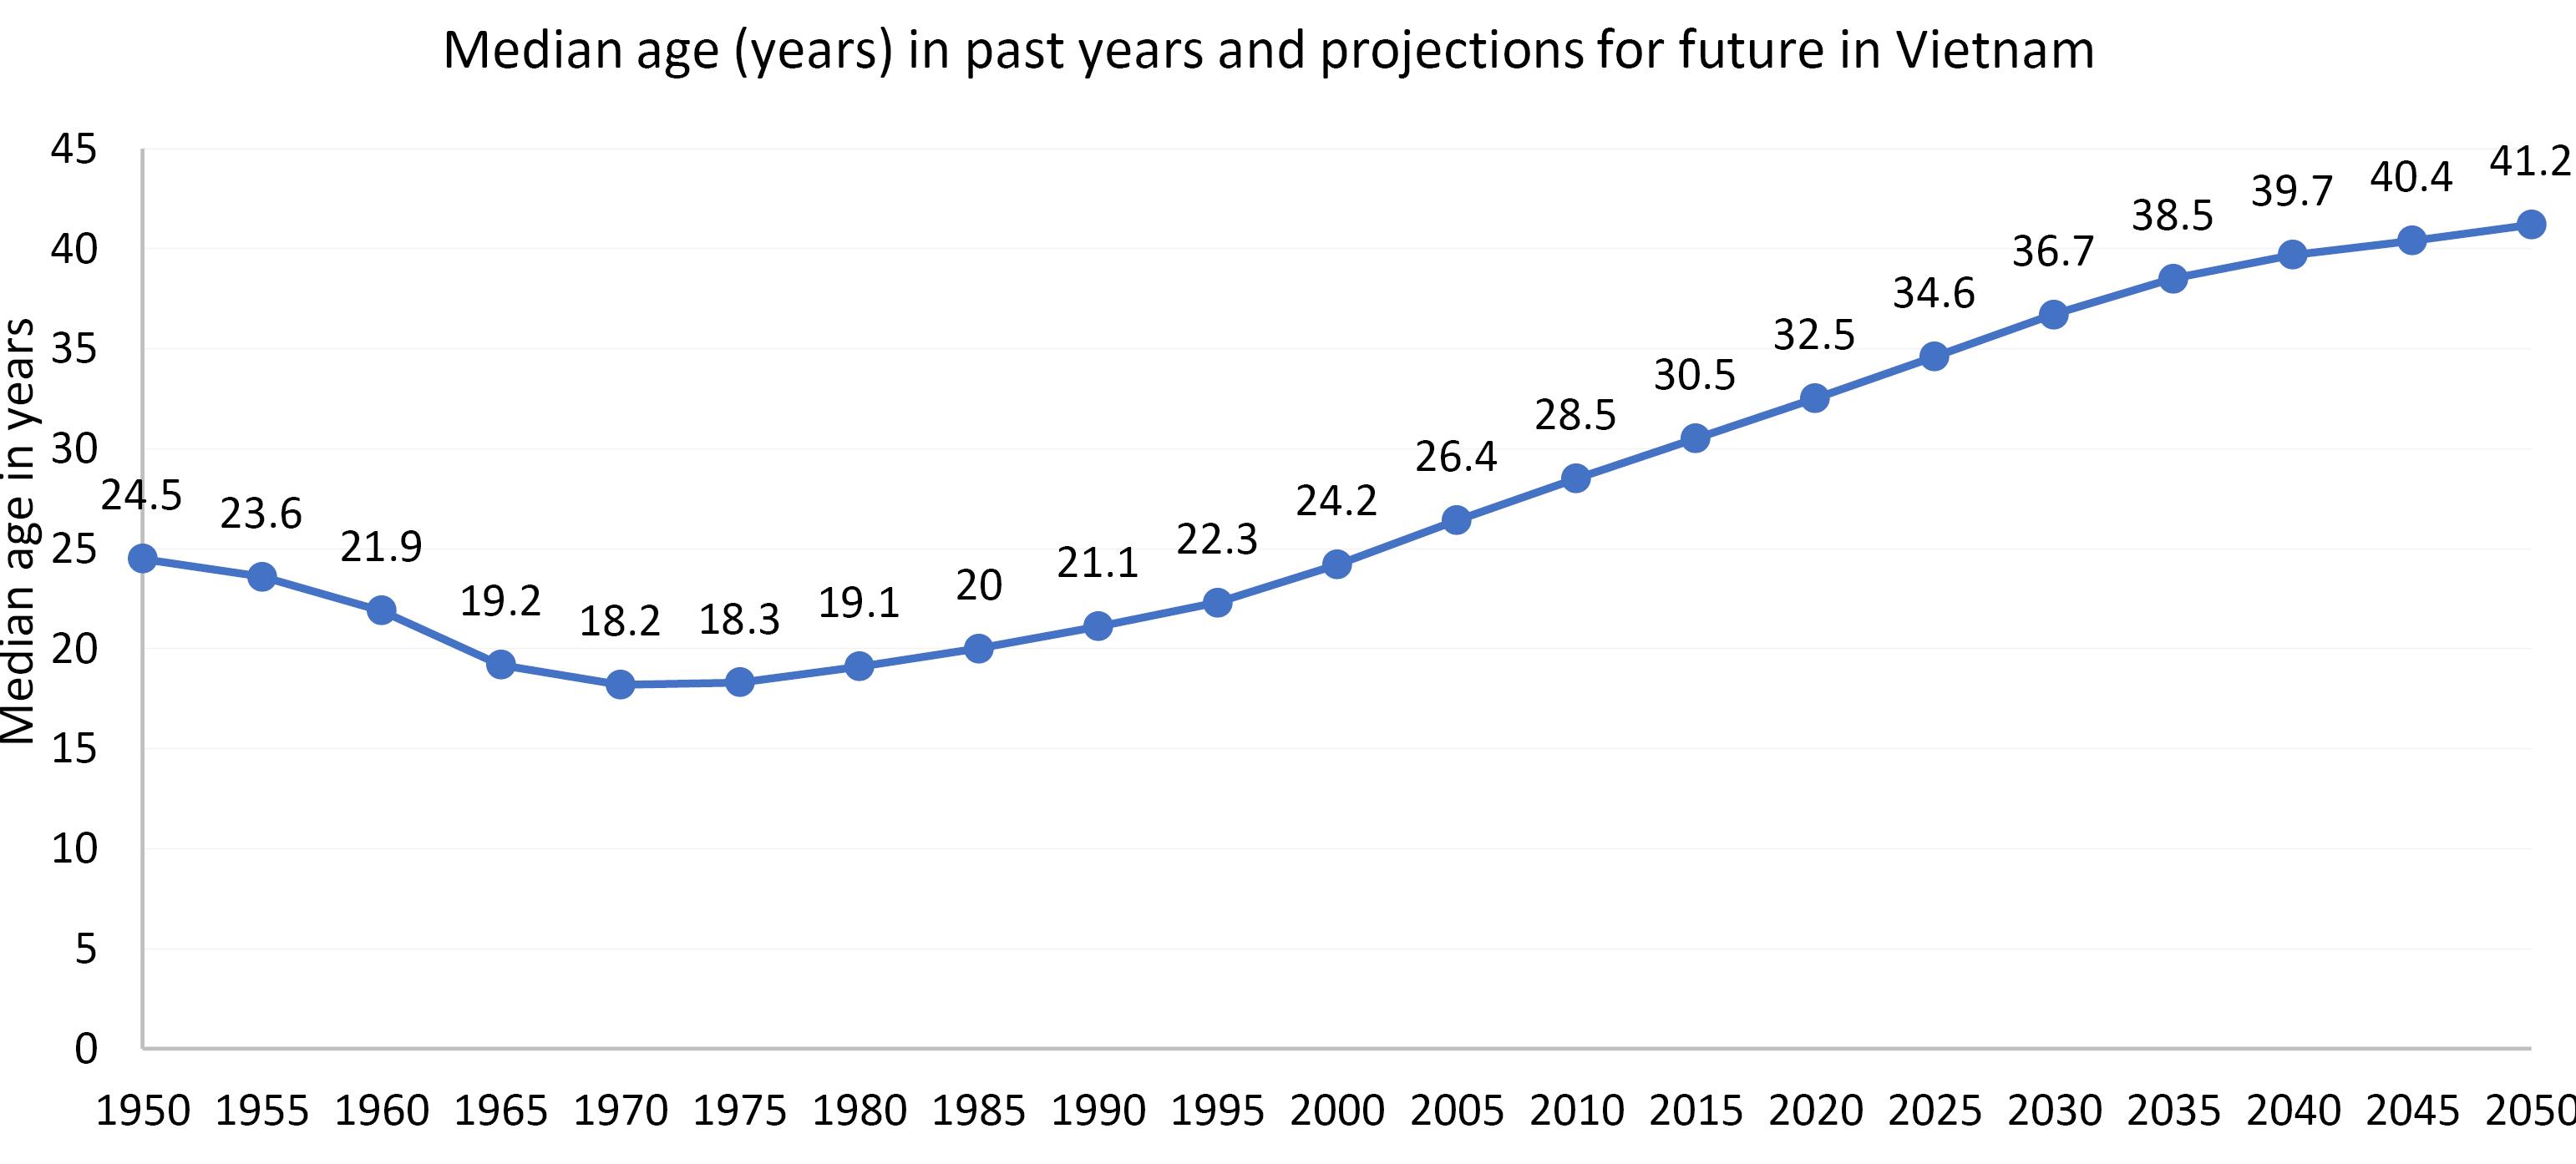
Figure 5.
Median Age (Past, Current, and Projected) in Vietnam.13
.
Median Age (Past, Current, and Projected) in Vietnam.13
Demography of Aging Population in Vietnam (Regional) in 2019
Vietnam has been traditionally divided into three main regions: North, Central, and South, each distinguished by unique geographical and cultural features.
-
Northern Region: It is characterized by mountainous terrain and a cooler climate. The Northern Region is home to the capital city, Hanoi. It is renowned for its rich history and cultural heritage. This region has played a significant role in shaping Vietnam’s political landscape.
-
Central Region: It stretches from the northern to the southern borders of Vietnam. The Central Region boasts a diverse landscape, encompassing coastal areas and highlands. This area has been a historical and cultural crossroads for centuries.
-
Southern Region: It encompasses the Mekong Delta and major urban centers like Ho Chi Minh City (formerly Saigon). The Southern Region features a tropical climate and fertile plains. It serves as an economic hub and plays a vital role in Vietnam’s overall development.
Vietnam consists of 5 major cities and 57 provinces. The Population and Housing Census (PHC) is conducted every decade, with the fifth census taking place in 2019., It began on April 1, 2019, under Prime Minister’s Decision No. 772/QĐ-TTg dated June 26, 2018.16 Table 4 illustrates the distribution of the aging population, categorized by gender, in each major city and province in Vietnam. Numbers 1-31 represent Northern cities and provinces, 32-44 represent the Central Region, and the remainder belong to the Southern Region. The old-age dependency ratio, indicating the proportion of the older adult population (65 years and above) to the working-age population (15–64 years old), is approximately 11% nationwide. This implies that 10 working individuals support 1 older person.
Table 4.
Demographics in Vietnam in 2019
|
|
Aging Population (Total)
|
Aging Population (Male)
|
Aging Population (Female)
|
Old-Age Dependency Ratio
|
|
The entire country
|
7.7%
|
6.2%
|
9.2%
|
11%
|
| Hà Nội |
8.2% |
6.8% |
9.5% |
12.2% |
| Hà Giang |
4.8% |
3.5% |
6.2% |
7.8% |
| Cao Bằng |
7.2% |
5.1% |
9.4% |
10.9% |
| Bắc Kạn |
6.7% |
5.0% |
8.5% |
9.9% |
| Tuyên Quang |
7.0% |
5.2% |
8.7% |
10.7% |
| Lào Cai |
4.7% |
3.5% |
5.9% |
7.3% |
| Ðiện Biên |
4.4% |
3.6% |
5.2% |
7.2% |
| Lai Châu |
3.7% |
2.7% |
4.7% |
6.1% |
| Sơn La |
4.7% |
3.8% |
5.7% |
7.4% |
| Yên Bái |
6.8% |
5.2% |
8.5% |
10.6% |
| Hoà Bình |
6.7% |
5.1% |
8.4% |
10.0% |
| Thái Nguyên |
7.6% |
6.2% |
9.1% |
11.3% |
| Lạng Sơn |
6.7% |
4.8% |
8.7% |
9.8% |
| Quảng Ninh |
7.8% |
6.4% |
9.2% |
11.6% |
| Bắc Giang |
7.5% |
5.9% |
9.1% |
11.3% |
| Phú Thọ |
9.0% |
7.1% |
10.8% |
13.8% |
| Vĩnh Phúc |
8.0% |
6.1% |
10.0% |
12.5% |
| Bắc Ninh |
7.2% |
5.8% |
8.7% |
10.6% |
| Hải Dương |
10.0% |
8.2% |
11.8% |
15.2% |
| Hải Phòng |
9.3% |
7.8% |
10.8% |
13.9% |
| Hưng Yên |
9.8% |
7.7% |
12.0% |
15.1% |
| Thái Bình |
12.7% |
10.5% |
14.7% |
19.5% |
| Hà Nam |
10.8% |
8.6% |
12.8% |
16.6% |
| Nam Ðịnh |
12.0% |
10.1% |
13.8% |
18.9% |
| Ninh Bình |
10.2% |
8.3% |
12.1% |
15.9% |
| Thanh Hoá |
9.5% |
7.3% |
11.6% |
14.4% |
| Nghệ An |
8.3% |
6.6% |
10.0% |
12.7% |
| Hà Tĩnh |
11.2% |
9.2% |
13.2% |
18.0% |
| Quảng Bình |
8.5% |
7.3% |
9.8% |
13.2% |
| Quảng Trị |
9.5% |
7.7% |
11.4% |
15.2% |
| Thừa Thiên Huế |
9.3% |
7.5% |
11.1% |
14.0% |
| Ðà Nẵng |
6.2% |
4.8% |
7.6% |
8.8% |
| Quảng Nam |
9.9% |
7.4% |
12.4% |
15.1% |
| Quảng Ngãi |
10.5% |
8.2% |
12.7% |
16.0% |
| Bình Ðịnh |
10.1% |
7.9% |
12.3% |
15.2% |
| Phú Yên |
8.5% |
6.9% |
10.2% |
12.7% |
| Khánh Hoà |
7.4% |
5.9% |
8.9% |
10.6% |
| Ninh Thuận |
6.3% |
4.9% |
7.7% |
9.5% |
| Bình Thuận |
6.8% |
5.3% |
8.2% |
9.9% |
| Kon Tum |
4.4% |
3.5% |
5.2% |
7.0% |
| Gia Lai |
4.8% |
3.9% |
5.7% |
7.6% |
| Ðắk Lắk |
5.5% |
4.5% |
6.6% |
8.3% |
| Ðắk Nông |
3.8% |
3.0% |
4.6% |
5.9% |
| Lâm Ðồng |
5.8% |
4.8% |
6.9% |
8.6% |
| Bình Phước |
5.3% |
4.3% |
6.3% |
7.8% |
| Tây Ninh |
7.0% |
5.5% |
8.4% |
9.7% |
| Bình Dương |
3.1% |
2.4% |
3.9% |
4.1% |
| Ðồng Nai |
5.5% |
4.4% |
6.5% |
7.7% |
| Bà Rịa - Vũng Tàu |
6.3% |
5.2% |
7.5% |
9.1% |
| TP. Hồ Chí Minh |
5.6% |
4.4% |
6.7% |
7.4% |
| Long An |
7.8% |
6.2% |
9.5% |
11.0% |
| Tiền Giang |
9.1% |
7.1% |
11.0% |
12.9% |
| Bến Tre |
10.1% |
7.6% |
12.5% |
14.4% |
| Trà Vinh |
8.6% |
6.8% |
10.4% |
12.7% |
| Vĩnh Long |
9.6% |
7.9% |
11.4% |
13.8% |
| Ðồng Tháp |
8.6% |
7.3% |
9.8% |
12.3% |
| An Giang |
8.5% |
7.3% |
9.7% |
12.7% |
| Kiên Giang |
7.0% |
5.9% |
8.1% |
10.0% |
| Cần Thơ |
7.6% |
6.4% |
8.8% |
10.6% |
| Hậu Giang |
8.9% |
7.4% |
10.3% |
13.0% |
| Sóc Trăng |
8.7% |
7.3% |
10.2% |
12.9% |
| Bạc Liêu |
7.6% |
6.5% |
8.7% |
10.7% |
| Cà Mau |
7.8% |
6.8% |
8.8% |
11.3% |
Table is reproduced by authors. Source: 16
The province with the lowest aging population is Binh Duong in the South (3.1%), while Thai Binh province in the North has the highest aging population (12.7%). Similarly, the old-age dependency ratio ranges from 4.1% (Binh Duong) to 19.5% (Thai Binh). The aging population in males varies from 2.4% to 10.5%, while in females, it ranges from 3.9% to 14.7%, indicating that the female population is aging faster than the male population. Thai Binh has the highest old-age dependency ratio (20%), implying that five working persons support one older adult. In contrast, Binh Duong has the lowest ratio (4.1%).
Discussion
This section explores the impacts of the aging population in Vietnam, addressing various aspects as discussed below.
Macroeconomic Impact
The aging population has a detrimental impact on the productivity and economic growth of the country. The study conducted by Lindh and Malmberg17 and corroborated by Aiyar and Ebeke18 suggested an inverse relationship between the population aged 65 and above and productivity. Studies in East Asia, as indicated in a previous study,19 emphasize the significant impact of the old-age dependency ratio on the economic growth of a country. The rise in the old-age dependency ratio places an additional burden on the working-age population, requiring them to support more individuals and potentially leading to higher taxes for funding healthcare. This, in turn, creates disincentives for work and investment, resulting in a decline in overall productivity and economic growth.20 Moreover, older individuals may face challenges adapting to technological and business model changes, posing a threat to the international competitiveness of the country.21 As the demographic transition progresses, with a shift from a young to an older population and declining fertility rates, the economically active population is expected to decrease, leading to shortages in the labor market. This aging trend may particularly impact occupations such as construction, farming, and manual labor, where a preference for younger workers exists.22
The aging population may contribute to increased urban-rural migration, with older individuals seeking rural areas for lower crime rates, greater greenery, and a slower pace of life.23 This migration pattern could lead to a decline in urban populations, potentially causing businesses to shut down due to decreased demand and resulting in unemployment. Additionally, it may reduce investment in cities, posing challenges for long-term growth.24,25 Another consequence could be a rise in older adult poverty, caused by families unable or unwilling to care for the elderly and pension systems lacking sufficient strength to support them. This scenario may lead to both relative and absolute poverty, ultimately impacting long-term living standards.26-28
Fiscal Sustainability
The rapid growth of the aging population poses a significant threat to fiscal sustainability, characterized by two key challenges: (1) a decline in taxpayers due to the diminishing working-age population and (2) increasing government spending on healthcare for the aging population.29 This dynamic leads to a surge in public debt, marked by higher healthcare expenditures for the elderly and reduced tax revenue resulting from a shrinking working-age population. The increased allocation to healthcare systems represents an opportunity cost, diverting funds away from economic development.30,31 In regions like Europe and Latin America, where public transfers are substantial, unchanged taxation and benefit patterns will intensify fiscal pressure on public transfer systems due to the aging population. Conversely, in Southern and South-Eastern Asian countries with relatively low public transfers, individuals and families face significant pressure to self-finance their consumption during old age.
Consequences of Aging Population in Vietnam
The consequences of aging are evident in Vietnam’s tax revenue, national debt, and government health expenditure. Figure 6 illustrates a decline in tax revenue over the years. The national debt, measured as a percentage of gross domestic product (GDP), represents the financial obligations of the national government. Figure 7 shows no definitive trend in the national debt as a percentage of GDP, displaying an upward trend until 2022 and a projected decline thereafter. The surge in government spending creates a fiscal imbalance as revenues decline (Figure 6), with recent years witnessing an increase in health expenditure compared to historical figures (Figure 8). This underscores the potential impact of aging on the economic growth of a country without appropriate policy interventions in the future.
The Vietnamese government has taken the following measures to tackle the challenges associated with the aging population.
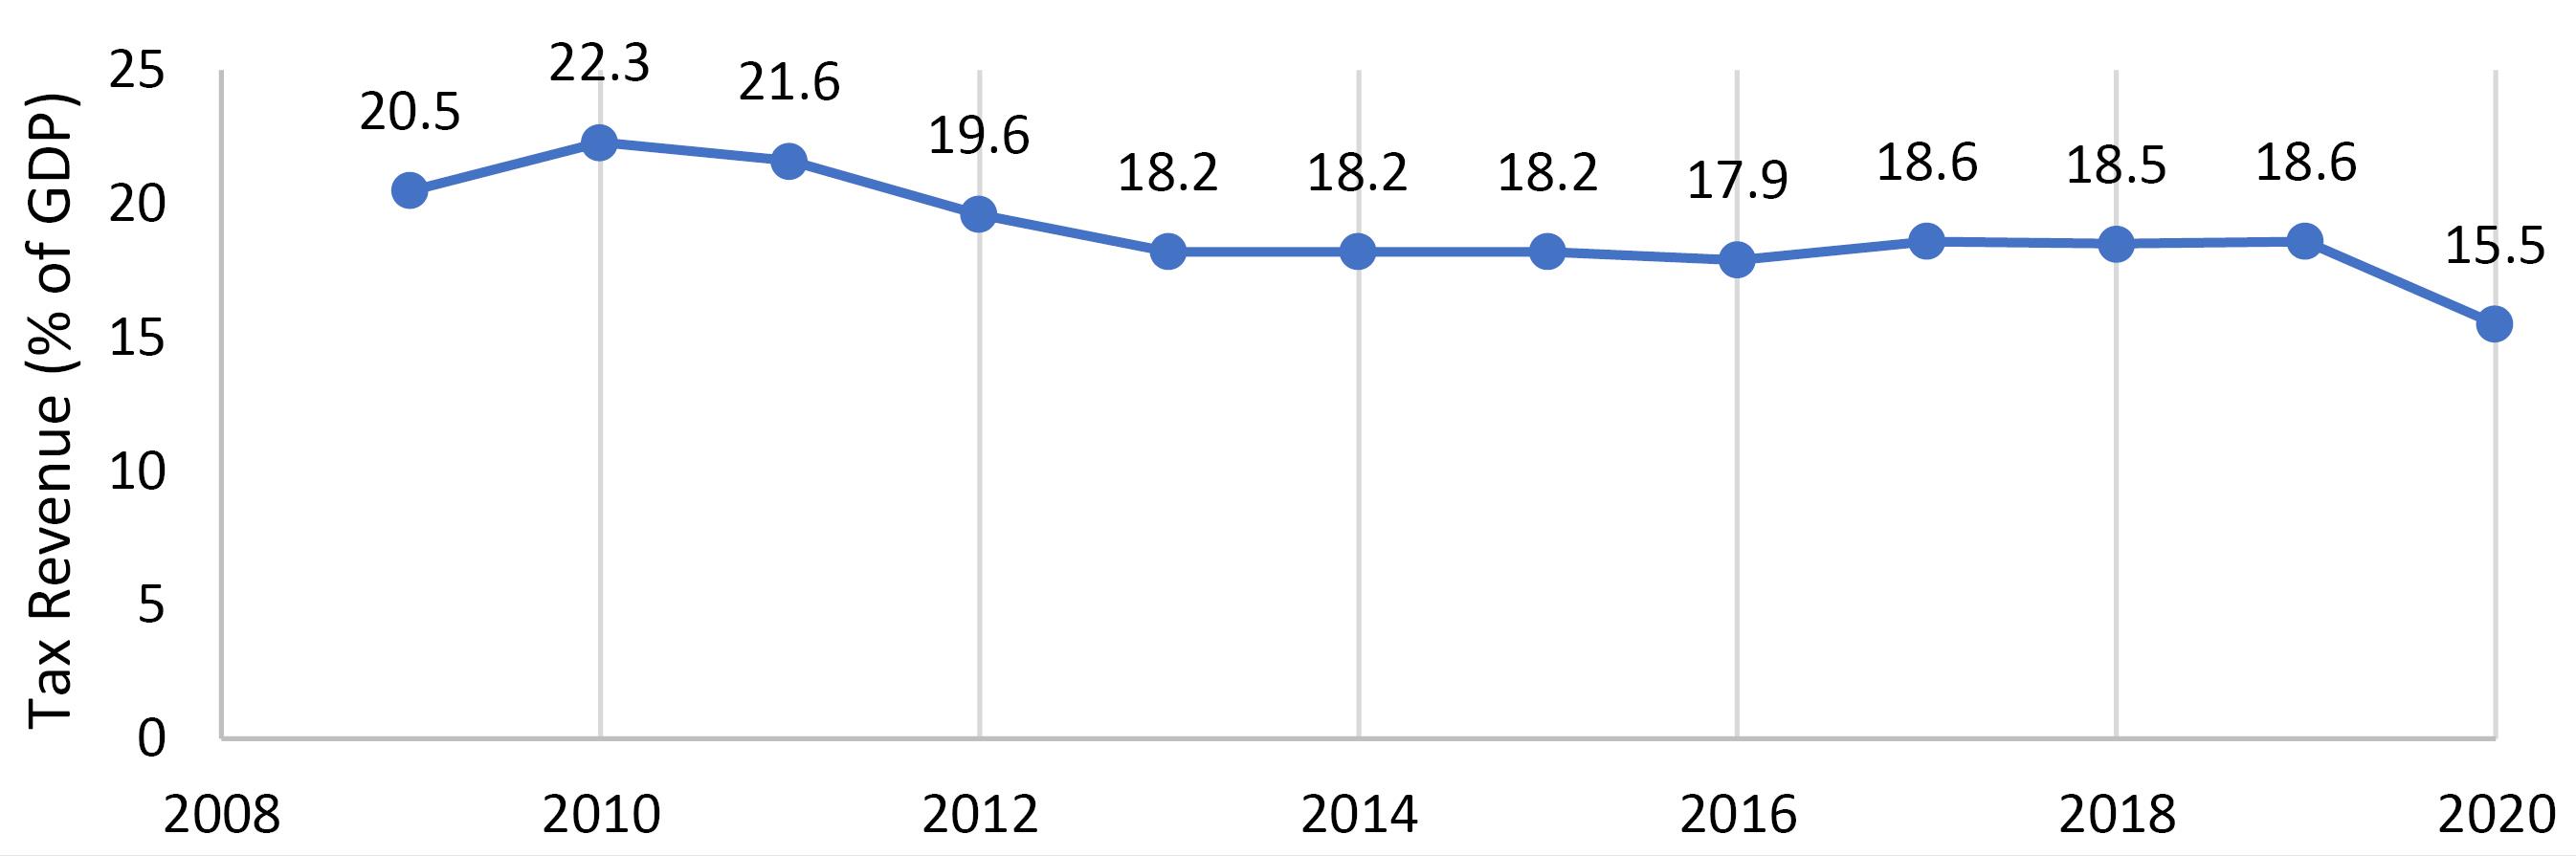
Figure 6.
Government’s Tax Revenue (% of GDP).32
.
Government’s Tax Revenue (% of GDP).32
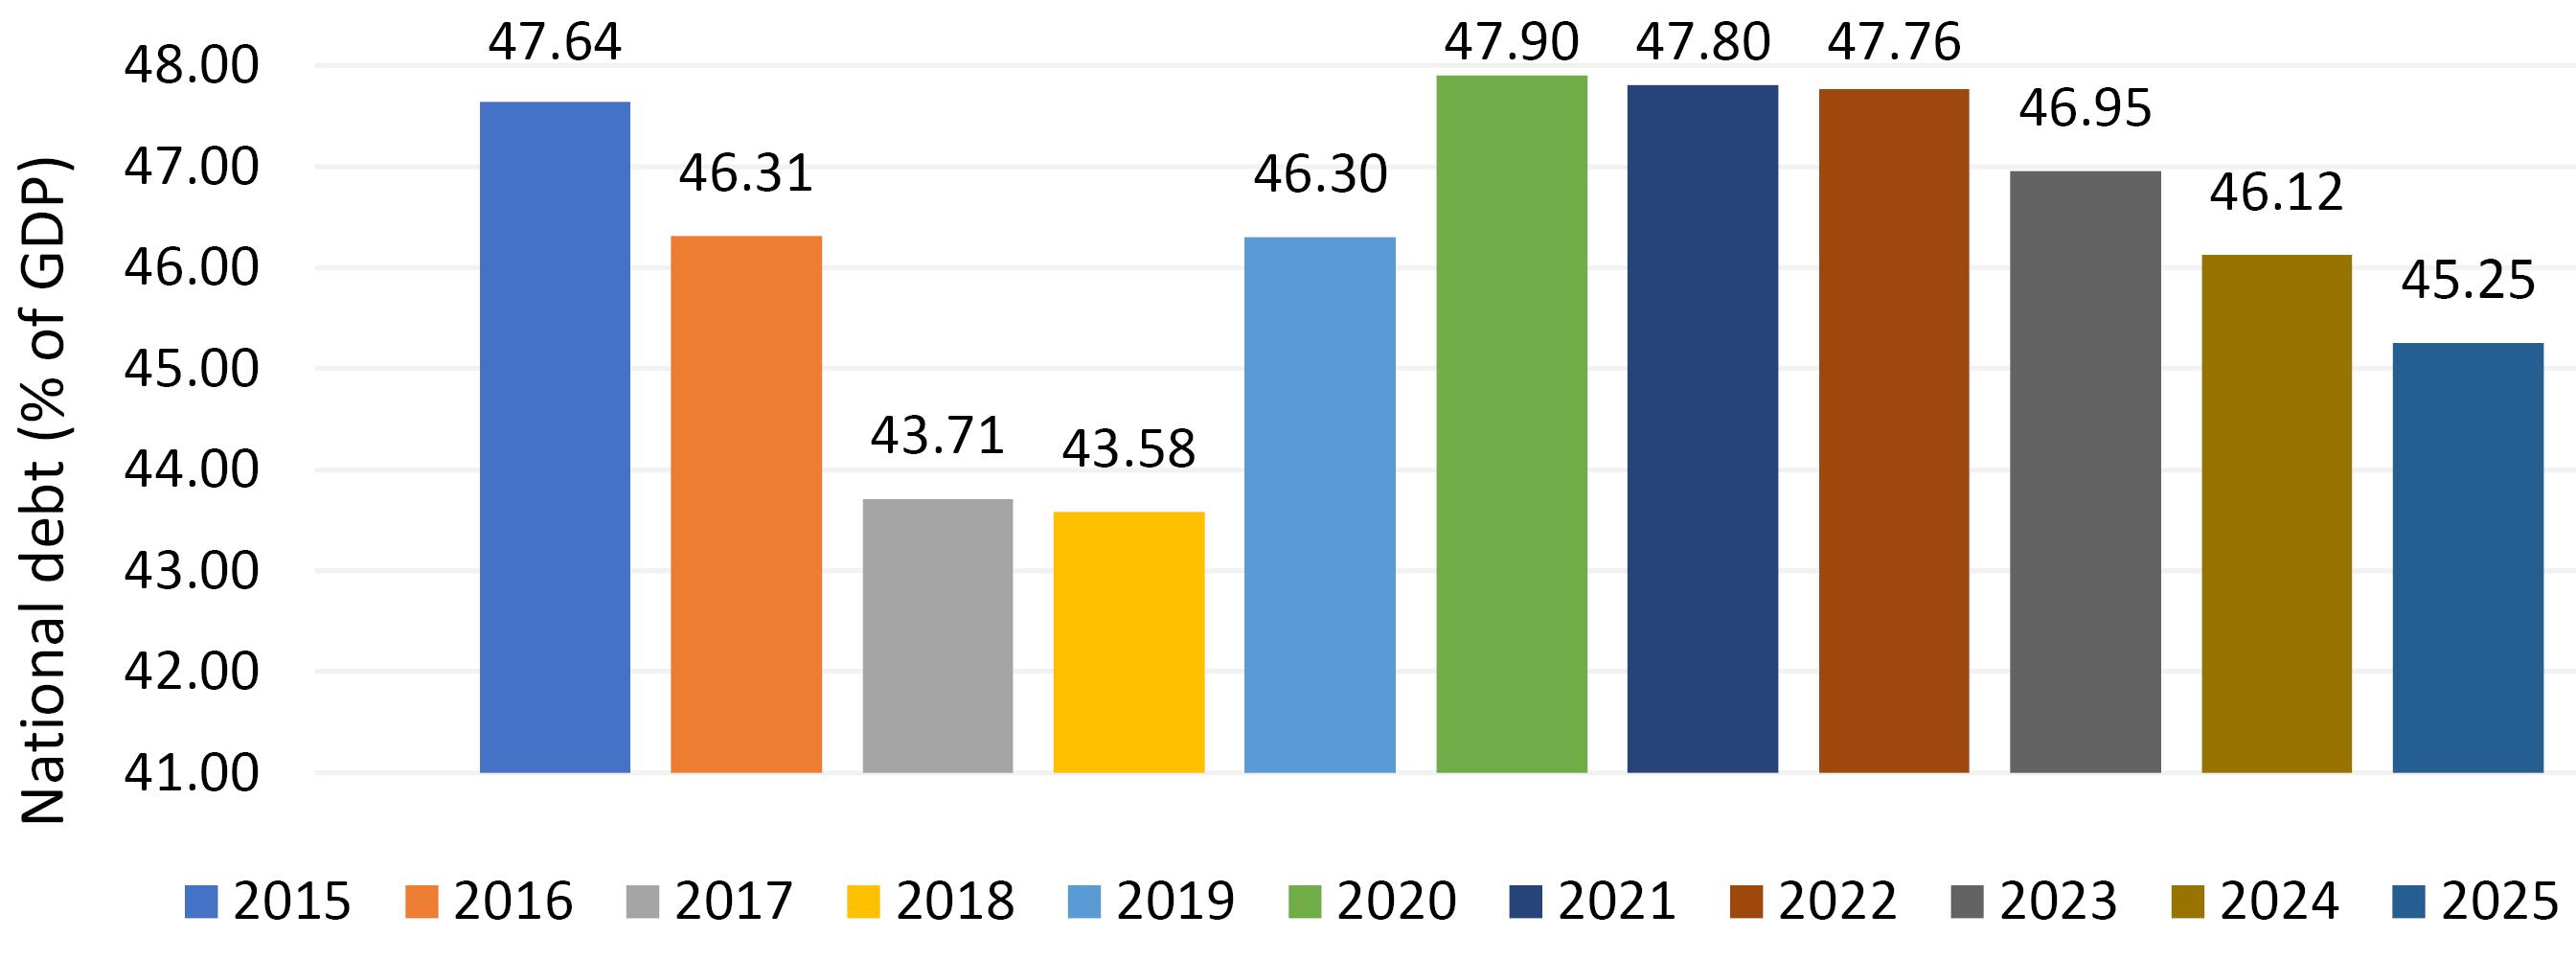
Figure 7.
National Debt of Vietnam from 2016 to 2026 (Projected) Concerning the Gross Domestic Product.15
.
National Debt of Vietnam from 2016 to 2026 (Projected) Concerning the Gross Domestic Product.15
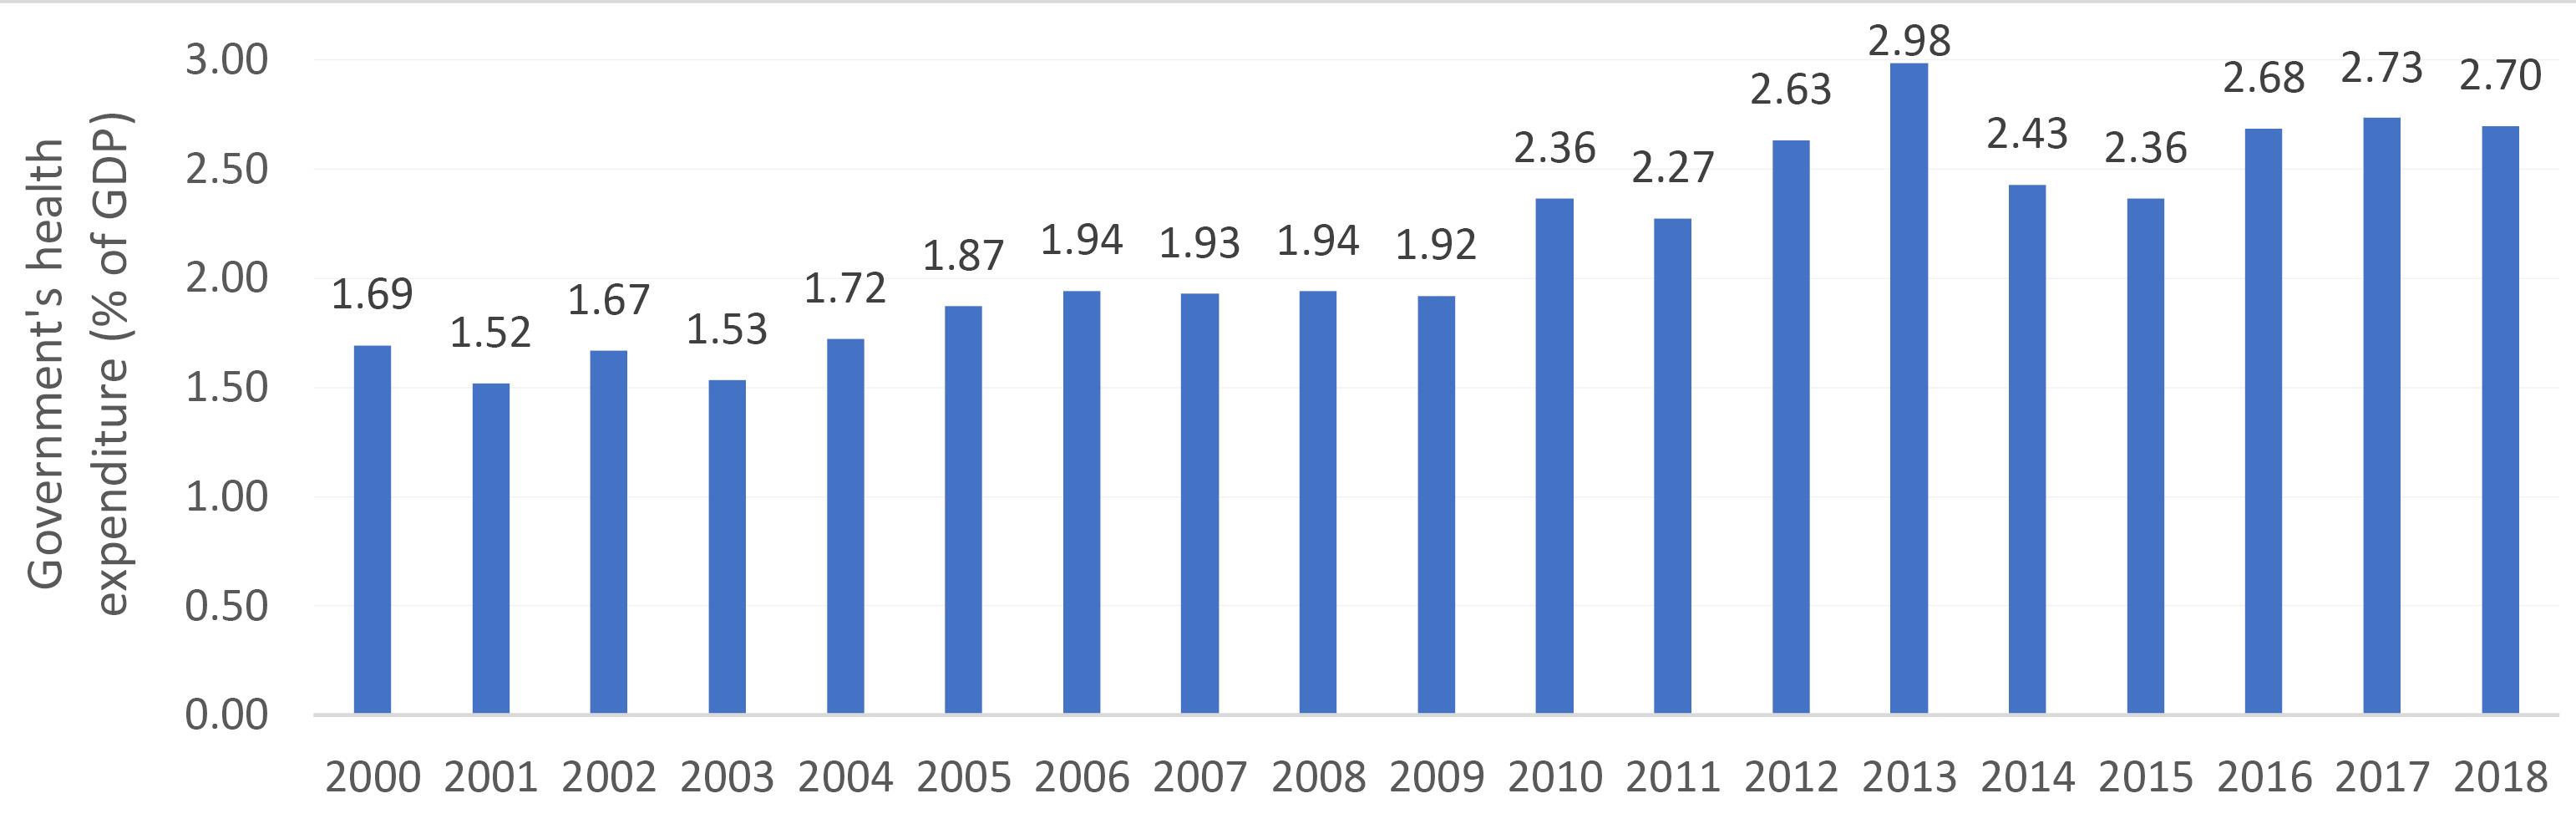
Figure 8.
Government’s Health Expenditure (% of GDP).13
.
Government’s Health Expenditure (% of GDP).13
Government Initiative 1: Raising the Retirement Age
To overcome the issue of early retirement, Vietnam has increased the retirement age from 55 to 60 years for women and from 60 to 62 years for men starting in 2021.33 However, it will be very unpopular, especially among those reaching retirement age. Increasing the retirement age can be a short-term solution as it increases the working-age population for a few years, which helps reduce the pension expenses and health care burden on the government.34
Government Initiative 2: Encouraging Young Parents to Increase the Fertility Rate
To address the rapidly growing aging population, the Vietnamese government promotes early marriage and encourages young couples to have more children. In line with this initiative, Prime Minister Nguyen Xuan Phuc issued Decision No. 588 in late April, urging individuals to marry before the age of 30 and ideally have their second child by the age of 35.35 This decision aims to sustain a favorable total replacement fertility rate, defined as the average number of children born per woman needed to maintain the population level in the future, typically around 2.1 children per woman for most countries.36
Recommendations
The Vietnamese government must devise a strategy to study the demographic shift while sustaining the economic growth of the country. The diminishing labor force implies fewer individuals contributing taxes, resulting in reduced government tax revenue. Concurrently, government expenditure rises to support the aging population through regular pensions and healthcare services. This scenario, characterized by decreased tax revenue and increased spending, may lead to a prolonged budget deficit, posing long-term sustainability challenges. Additionally, it could impose a burden on the working population through potential future tax increases. The recommendations outlined below aim to address the aging issue in both the short and long term, supplementing the measures already implemented by the government. Hence, in addition to the government’s efforts, the following six recommendations are offered to address the challenges posed by the aging population.
Recommendation 1: Enhancing the Skilled Workforce and Promoting Diversity in Labor Force Participation
It is crucial to promote skilled immigration for immediate workforce needs, but considering the long-term impact on the aging population, there is a parallel need to focus on educating and training the younger generation. Access to education and training should be expanded to upgrade workforce skills. For instance, data from 2019 census reveals that 26 out of 100 individuals at high school age do not attend high school. Moreover, only 39.1% of the workforce has achieved high school or higher qualifications, and merely 23.1% hold professional certificates.37 This underscores a challenge for high-tech foreign investors seeking to invest in Vietnam, as there is a demand for more highly trained and skilled workers. Addressing this challenge involves supporting skill development in the workforce, ultimately boosting productivity and fostering growth. Building a technologically advanced economy is imperative for sustained economic development in the medium to long term.
Recommendation 2: Investment in Technology, Research and Development (R&D), Human Capital, and Education
To address workforce gaps, leveraging artificial intelligence and technology is imperative. This approach ensures sustained production, leading to increased consumption and contributing to the country’s economic growth. While investing in technology may be a costly endeavour, it offers a long-term solution. To stimulate innovation and create more investment opportunities, there should be an emphasis on increasing funding for research and development. Investing in human capital through training programs is essential for upskilling both the aging population and the existing workforce. Training enables older individuals to easily adapt to technological innovations. Additionally, development of the healthcare system with a focus on information technology facilitates and incorporating them to disease management activities accessible to and adaptable by the older population deem necessary.
Recommendation 3: Encouraging Replacement Migration for Sustaining Workforce and Skills
Replacement migration is another long-term solution to the aging problem, and it is the amount of migration across international borders that would be required to counteract population aging generally as well as declines in working-age population size. Replacement migration has proven beneficial to populations with low fertility rates and decreases in population size, as it helps maintain a younger demographic profile in many European countries. Hence, the policies that can encourage international migration to Vietnam will help the country maintain the working-age population and increase the skilled workforce.
Recommendation 4: Enhancing Funding and Research Opportunities
To strengthen the foundations for sustainable development, it is crucial to increase investments in R&D. This involves not only enhancing funding opportunities but also creating an environment that fosters innovation and technological advancement. By allocating resources to R&D initiatives, Vietnam can harness the power of innovation to tackle the challenges posed by the aging population. This recommendation emphasizes the importance of creating a robust framework for funding and research activities to propel the nation towards a future marked by economic resilience and continuous growth.
Recommendation 5: Implementing Comprehensive Social Protection Programs
In response to the mounting financial pressure on old-age support systems resulting from aging, it is imperative to implement enduring and comprehensive social protection programs. These initiatives aim to reduce poverty, diminish inequality, and foster social inclusion for older individuals.5,38 Long-term care policies, including health and life insurance packages, can be introduced with subsidized premiums for older individuals, alleviating the burden on both younger family members and older individuals responsible for self-care.
Recommendation 6: Increase Income Tax Revenue
Adjusting income tax rates to generate additional revenue for balancing increased health and pension expenditures could be considered as a potential solution to address fiscal balance challenges in the country. However, it may face resistance due to potential unpopularity and can reduce work incentives. This approach may serve as a short-term measure to investigate challenges associated with the aging population.
Conclusion
In conclusion, population aging is an inevitable phenomenon that profoundly impacts a country’s economic performance, as well as its fiscal and monetary policies. Rapid population aging presents both opportunities and challenges for Vietnam. To maximize the benefits and effectively manage the risks, the government should formulate appropriate and adaptive policies. These policies should prioritize continuing lifelong education and healthcare to ensure equal opportunities for women and older individuals.3. They should also focus on increasing the skilled workforce and fostering diversity in the labor force. Implementing family-friendly policies that support work-life balance can contribute to enhanced gender equality.3,39 Additionally, investing in technology, research and development, and human capital development is crucial for maintaining production despite the shrinking workforce. Encouraging international migration is another avenue to address the aging problem, and policies designed to attract migrants can be beneficial. Strengthening the old-age support system through the introduction of social protection programs can alleviate the burden on younger family members. While it may be inevitable to prevent the country’s population from aging, well-chosen policies can mitigate the macroeconomic decline associated with population aging.
Limitations and Directions for Future Research
Similar to other research studies, this study also has certain limitations. First, it is essential to note that this article is primarily a review (commentary) and hence lacks empirical evidence. Future studies can focus on empirical evidence to identify the effects of aging. Second, empirical studies and reviews (commentary) should be carried out to make comparisons between Vietnam and other nations and provide valuable insights into the diverse strategies employed worldwide to tackle the challenges of an aging population. Third, a panel study would contribute to a more comprehensive understanding of the aging issue in Vietnam. These panel studies might focus on specific aspects and variables, as listed below:
-
Economic Dynamics: conducting a longitudinal analysis of GDP growth, labor force participation, and economic productivity over time in relation to the evolving demographic structure
-
Health and Well-being: tracking health outcomes and overall well-being of the aging population, examining factors such as healthcare access, prevalence of chronic diseases (e.g., heart diseases),40 obesity issues,41 and mental health indicators
-
Regional Variation: investigating regional disparities in aging trends, considering differences in healthcare infrastructure, socioeconomic conditions, and cultural factors
-
Gender-specific Challenges: analyzing gender-specific aspects of aging, including economic disparities, health challenges, and social integration, to comprehend the unique experiences of older adult men and women
-
Impact on Caregivers: assessing the effects of aging on families and caregivers, studying changes in family structures, caregiver burden, and the effectiveness of support systems
-
Technological Adaptation: evaluating the adoption of technology among the aging population, tracking changes in digital literacy, technology use, and its impact on daily life and productivity
-
Migration Patterns: examining the patterns and effects of international migration in response to population aging, understanding how migration contributes to or mitigates challenges associated with an aging population
-
Effectiveness of Government Policy: evaluating the effectiveness of government initiatives, such as changes in retirement age and fertility encouragement, by assessing their impact on the aging population and the overall economy
-
Socio-psychological Dimensions: Exploring socio-psychological aspects of aging, including loneliness, mental health challenges, and the effectiveness of existing social support systems
Fourth, within the existing literature on aging in Vietnam, a notable limitation is the relatively scant attention given to the socio-psychological aspects of aging. Although this paper delves into economic impacts and provides policy recommendations, there exists a discernible gap in the exploration of mental health, social integration, and the overall well-being of the aging population. Future research endeavors could delve into the psychosocial dimensions of aging in Vietnam, probing into factors such as loneliness, mental health challenges, and the efficacy of prevailing social support systems. The fifth limitation is the need for more in-depth regional analyses. While the paper provides a broad overview of aging trends in Vietnam, it does not extensively explore regional variations. Future research could delve into the unique challenges faced by aging populations in different provinces or cities, considering variations in healthcare infrastructure, socioeconomic conditions, and cultural factors. This regional approach could offer more targeted policy recommendations tailored to specific contexts.
Sixth, there is a gap in understanding the experiences of different demographic groups within the aging population, such as gender-specific challenges or the impact of rural-urban disparities. Future research could adopt a more intersectional approach to uncover how factors like gender, location, and socioeconomic status intersect with aging experiences in Vietnam. Finally, there may be limitations related to data sources and research methodologies employed in this study. Future research could explore innovative data collection methods, such as longitudinal studies or qualitative approaches, to provide a more nuanced understanding of the dynamic and evolving nature of aging in Vietnam.
Author contributions
Conceptualization: Anika Maheshwari.
Data curation: Anika Maheshwari, Greeni Maheshwari.
Formal analysis: Anika Maheshwari, Greeni Maheshwari.
Investigation: Anika Maheshwari, Greeni Maheshwari.
Methodology: Anika Maheshwari, Greeni Maheshwari.
Project administration: Anika Maheshwari.
Resources: Anika Maheshwari, Greeni Maheshwari.
Software: Anika Maheshwari, Greeni Maheshwari.
Supervision: Anika Maheshwari, Greeni Maheshwari.
Validation: Anika Maheshwari, Greeni Maheshwari.
Visualization: Anika Maheshwari, Greeni Maheshwari.
Writing–original draft: Anika Maheshwari, Greeni Maheshwari.
Writing–review & editing: Anika Maheshwari, Greeni Maheshwari.
Funding
None.
Data availability statement
All data generated or analyzed during the study are included in this published article.
Ethical approval
Not Applicable.
Consent for publication
Not Applicable.
Conflict of interests
The Authors declares that there is no conflict of interest.
References
- Fathi M, Ahmadinia A, Pourhassan N, Ebrahimi Bakhtavar H, Rahmani F. Road safety as an essential need of aged population: a case of Tabriz city, Iran. Int J Aging 2023; 1(1):e15. doi: 10.34172/ija.2023.e15 [Crossref] [ Google Scholar]
- Phillips DR. Ageing in the Asia-Pacific Region: Issues, Policies and Future Trends. 1st ed Routledge; 2002.
- United Nations, Department of Economic and Social Affairs, Population Division. World Population Prospects 2019: Highlights (ST/ESA/SER. A/423). New York: United Nations; 2019.
- Bloom DE, Canning D, Finlay JE. Population aging and economic growth in Asia. In: The Economic Consequences of Demographic Change in East Asia. University of Chicago Press; 2010. p. 61-89.
- Cai Y, Feng W, Shen K. Fiscal implications of population aging and social sector expenditure in China. Popul Dev Rev 2018; 44(4):811-31. [ Google Scholar]
- Nikolova M. Two Solutions to the Challenges of Population Aging. The Brookings Institute. 2016.
- Daniel MJ. Fiscal Adjustment for Stability and Growth. Washington, DC: International Monetary Fund; 2006.
- Véron J. [Review of preparing for an aging world: the case for cross-national research, by National Research Council]. Population 2001; 56(5):885-6. doi: 10.2307/1534892 [Crossref] [ Google Scholar]
- Pham L. Aging in Vietnam: The Elderly to Account for 20.4% by 2050. Hanoi Times; 2021.
- Dezan Shira & Associates. Understanding Vietnam’s Labor Market and Key HR Compliance. Dezan Shira & Associates; 2021.
- Population Pyramids. 2019. Available from: https://www.populationpyramid.net/viet-nam/.
- Rajan SI, Mishra U, Sarma PS. Demography of Indian aging, 2001-2051. In: An Aging India. Routledge; 2013. p. 11-30.
- World Bank. Vietnam: Adapting to An Aging Society. Available from: https://www.worldbank.org/en/country/vietnam/publication/vietnam-adapting-to-an-aging-society. Accessed October 23, 2021.
- ISEAS Commentary. Vietnam’s Aging Challenge: Getting Old Before Getting Rich? 2020. Available from: https://www.iseas.edu.sg/media/commentaries/vietnams-aging-challenge-getting-old-before-getting-rich/.
- Statista. Vietnam: Average Age of the Population from 1950 to 2100. Available from: https://www.statista.com/statistics/444584/average-age-of-the-population-in-vietnam/.
- Population Aging and Older Persons in Viet Nam [Internet]. 2021. Available from: https://www.gso.gov.vn/wp-content/uploads/2021/08/Dan-so-gia-hoaEN.pdf. Accessed January 18, 2021.
- Lindh T, Malmberg B. Age structure effects and growth in the OECD, 1950-1990. J Popul Econ 1999; 12(3):431-49. doi: 10.1007/s001480050107 [Crossref] [ Google Scholar]
- Aiyar MS, Ebeke MC. The Impact of Workforce Aging on European Productivity. International Monetary Fund; 2016.
- Bloom DE, Canning D, Fink G. Implications of population ageing for economic growth. Oxf Rev Econ Policy 2010; 26(4):583-612. doi: 10.1093/oxrep/grq038 [Crossref] [ Google Scholar]
- Nagarajan NR, Teixeira AAC, Silva ST. The impact of an ageing population on economic growth: an exploratory review of the main mechanisms. Anal Soc 2016; 51(218):4-35. [ Google Scholar]
- Czaja SJ, Lee CC. The impact of aging on access to technology. Univers Access Inf Soc 2007; 5(4):341-9. doi: 10.1007/s10209-006-0060-x [Crossref] [ Google Scholar]
- Ogura S, Jakovljevic MM. Global population aging-health care, social and economic consequences. Front Public Health 2018; 6:335. doi: 10.3389/fpubh.2018.00335 [Crossref] [ Google Scholar]
- Peng X, Song S, Sullivan S, Qiu J, Wang W. Ageing, the urban-rural gap and disability trends: 19 years of experience in China - 1987 to 2006. PLoS One 2010; 5(8):e12129. doi: 10.1371/journal.pone.0012129 [Crossref] [ Google Scholar]
- Jaumotte MF, Koloskova K, Saxena MS. Impact of Migration on Income Levels in Advanced Economies. International Monetary Fund; 2016.
- Boubtane E, Dumont JC, Rault C. Immigration and economic growth in the OECD countries 1986-2006. Oxf Econ Pap 2016; 68(2):340-60. doi: 10.1093/oep/gpw001 [Crossref] [ Google Scholar]
- Jackson PM. Economics of an aging population. J Epidemiol Community Health 1985; 39(2):97-101. doi: 10.1136/jech.39.2.97 [Crossref] [ Google Scholar]
- Giang TL, Pfau WD. The elderly population in Vietnam during economic transformation: an overview. In: Social Issues Under Economic Transformation and Integration in Vietnam. Vol 1. Hanoi: Vietnam Development Forum; 2007. p. 185-210.
- Chan CW. Leading today’s kindergartens: practices of strategic leadership in Hong Kong’s early childhood education. Educ Manag Adm Leadersh 2018; 46(4):679-91. doi: 10.1177/1741143217694892 [Crossref] [ Google Scholar]
- Yoshino N, Kim CJ, Sirivunnabood P. Aging population and its impacts on fiscal sustainability. In: Aging Societies: Policies and Perspectives. Asian Development Bank Institute; 2019.
- Mendelson DN, Schwartz WB. The effects of aging and population growth on health care costs. Health Aff (Millwood) 1993; 12(1):119-25. doi: 10.1377/hlthaff.12.1.119 [Crossref] [ Google Scholar]
- Liu Y. Focusing on the practice of distributed leadership: the international evidence from the 2013 TALIS. Educ Adm Q 2020; 56(5):779-818. doi: 10.1177/0013161x20907128 [Crossref] [ Google Scholar]
- CEIC Data. Vietnam Tax Revenue: % of GDP. 2022. Available from: https://www.ceicdata.com/en/indicator/vietnam/tax-revenue--of-gdp.
- Ho MT, La VP, Nguyen MH, Pham TH, Vuong TT, Vuong HM. An analytical view on STEM education and outcomes: examples of the social gap and gender disparity in Vietnam. Child Youth Serv Rev 2020; 119:105650. doi: 10.1016/j.childyouth.2020.105650 [Crossref] [ Google Scholar]
- Safiri S, Motlagh Asghari K, Sullman MJ. The global burden of diseases and injuries among older adults. Int J Aging 2023; 1:e16. doi: 10.34172/ija.2023.e16 [Crossref] [ Google Scholar]
- Vietnam Law & Legal Forum. Youngsters Encouraged to Marry by 30 And Have Two Children by 35. 2020. Available from: https://vietnamlawmagazine.vn/youngsters-encouraged-to-marry-by-30-and-have-two-children-by-35-27197.html.
- Smallwood S, Chamberlain J. Replacement fertility, what has it been and what does it mean? Popul Trends. 2005(119):16-27.
- Hiep LH. Vietnam’s Aging Challenge: Getting Old Before Getting Rich? ISEAS-Yusof Ishak Institute; 2020.
- Bezdìk V, Dybzcak K, Kreidl A. Fiscal implications of population ageing. Czech J Econ Finance 2003; 53(11-12):562-91. [ Google Scholar]
- Maheshwari G, Maheshwari A. Growing inequalities in the COVID-19 pandemic and their effect on women entrepreneurship: a case of Vietnam. Int Entrep Rev 2021; 7(4):65-73. doi: 10.15678/ier.2021.0704.05 [Crossref] [ Google Scholar]
- Mousavi SE, Fazlollahi A, Nejadghaderi SA, Aslani A, Sullman MJ, Kolahi AA. The burden of ischemic heart disease among adults 70 years and older in Iran, 1990-2019. Int J Aging 2023; 1(1):e9. doi: 10.34172/ija.2023.e9 [Crossref] [ Google Scholar]
- Pourali F, Araj-Khodaei M, Sahebihagh MH, Taheri-Targhi S, Karamzad N, Villani A. Obesity prevalence among older people in Tabriz, Iran: data from health status of aged people in Tabriz (HSA-T) study. Int J Aging 2023; 1(1):e8. doi: 10.34172/ija.2023.e8 [Crossref] [ Google Scholar]