Int J Aging. 2024; 2:e27.
doi: 10.34172/ija.2024.e27
Original Article
Association of Triglyceride-Glucose Index with Severity of Myocardial Ischemia According to Myocardial Perfusion Imaging
Mir-Hossein Seyed-Mohammadzad 1  , Saba Maleki 2, Reza Hajizadeh 1, *
Author information:
1Department of Cardiology, Urmia University of Medical Sciences, Urmia, Iran
2Student Research Committee, Urmia University of Medical Sciences, Urmia, Iran
Abstract
Objectives:
To evaluate the relationship between ischemia detected by myocardial perfusion imaging (MPI) and triglyceride-glucose (TyG) index.
Design:
A cross-sectional study.
Setting(s):
All patients were referred to a tertiary hospital and underwent myocardial perfusion scanning.
Participants:
One hundred fifteen patients who underwent myocardial perfusion scanning.
Outcome measures:
The formula LN [TG (mg/dL)×FBG (mg/dL)/2] was used to calculate the TyG index. The presence, severity, and extent of ischemia were determined based on the MPI reports.
Results:
The data from 115 patients, including 22 men (19.1%), with a mean age of 53.67±11.57 years, were analyzed in this study. The TyG index showed a significant association with the severity of ischemia as reported by MPI, increasing from 8.58±0.45 in non-ischemic patients to 9.6±0.33 in patients with severe ischemia. The final analysis revealed that a TyG index above 9.15, with a sensitivity of 68.4% and specificity of 84.2%, could predict a summed difference score of>0.
Conclusions:
A significant correlation was detected between the TyG index and ischemia using MPI.
Keywords: TyG, Triglyceride, Myocardial perfusion imaging, Ischemia
Copyright and License Information
© 2024 The Author(s).
This is an open access article distributed under the terms of the Creative Commons Attribution License (
http://creativecommons.org/licenses/by/4.0/), which permits unrestricted use, distribution, and reproduction in any medium, provided the original work is properly cited.
Funding Statement
This research did not receive any specific grant from funding agencies in the public, commercial, or not-for-profit sectors.
Please cite this article as follows: Seyed-Mohammadzad MH, Maleki S, Hajizadeh R. Association of triglyceride-glucose index with severity of myocardial ischemia according to myocardial perfusion imaging. Int J Aging. 2024;2:e27. doi: 10.34172/ija.2024.e27
Introduction
Coronary artery disease (CAD) is a condition in which the coronary blood supply is insufficient to meet the myocardial oxygen demand, resulting in myocardial ischemia and potentially a heart attack.1,2 CAD is a leading cause of death and illness globally and is primarily caused by atherosclerosis, the accumulation of plaque in the coronary arteries that disrupts blood flow.3,4 Other factors, such as endothelial dysfunction, microvascular diseases, and vasospasm, may also contribute to myocardial ischemia alongside atherosclerosis. Syndromes classified under CAD include chronic coronary syndrome, also known as stable angina, acute coronary syndrome (ACS), which includes ST-segment elevated and non-ST-segment elevated ACS, and sudden cardiac death. Atherosclerosis involves the thickening or hardening of arteries due to plaque buildup in the inner lining of the artery walls. Risk factors associated with atherosclerosis are high cholesterol and triglyceride levels, hypertension, smoking, diabetes, obesity, lack of physical activity, and a diet high in saturated fats. Hyperinsulinemia, along with insulin resistance, promotes inflammation and abnormal lipid levels, disrupting insulin signaling in key cells involved in plaque formation and leading to accelerated plaque buildup in the arteries.5,6
Cardiac stress testing is a crucial tool for diagnosing and managing patients with known or suspected CAD, focusing on assessing the presence and extent of inducible myocardial ischemia to determine clinical risk. The main stress testing methods are exercise and pharmacologic stress methods combined with imaging.7 The goal of stress testing is to evaluate how CAD affects the heart muscle’s function. Radionuclide myocardial perfusion imaging (MPI) is a technique that visualizes a radiopharmaceutical substance distributed in the myocardium in correlation with coronary blood flow, enabling the assessment of relative blood flow in different heart areas. The triglyceride-glucose index (the TyG index) is a good predictor of insulin resistance in healthy individuals.8 A high TyG index, indicating insulin resistance, has been linked to adverse cardiovascular events in patients with diabetes and cardiovascular disease, including stable CAD and ACS. Other studies have suggested that the TyG index can predict atherosclerosis, complete obstruction of coronary arteries by a clot, and CAD in diabetic and non-diabetic patients.9
Studies have demonstrated an independent association between TyG index values and plaque incidence.6 However, there are insufficient investigations to demonstrate any association between the TyG index and myocardial ischemia based on stress testing to assess functional myocardial alterations due to ischemia.
Thus, there is a need for more studies to reveal the association between TyG and the results of myocardial perfusion. Accordingly, this study seeks to investigate the association between the TyG index and the severity of ischemia in patients with chronic coronary syndrome who underwent MPI.
Methods
Study Design and Data Collection
A cross-sectional study focusing on 115 patients undergoing myocardial perfusion scanning was performed from March 2011 to April 2020. All patients had negative troponin-I levels and were admitted with suspected ACS.
MPI was ordered for patients with borderline exercise stress test results or for those unable to perform the exercise stress test. Patients with moderate to severe hyperreactive airway disease were excluded from the study due to safety concerns. Patients with a history of myocardial infarction and heart failure were excluded as well.
Data and Checklist
Demographic and laboratory data (e.g., fasting blood sugar and fasting triglycerides) of the patients were extracted from patient files. The TyG index was calculated using the formula LN [TG (mg/dL) × FBG (mg/dL)/2]. Moreover, information on the presence, severity, and extent of ischemia was obtained from MPI reports. Factors such as blood pressure, diabetes, body mass index, gender, and age were considered in analyzing the relationship between these factors and the presence and severity of ischemia reported by MPI. Additionally, the correlation between the TyG index and myocardial perfusion defect reported by MPI underwent evaluation.
The technetium-99m radiotracer was administered intravenously, followed by dipyridamole, a vasodilator, at a dose of 0.56 mg/kg. Stress images were taken 15–45 minutes after a second dose of radiotracer. Rest and stress images were analyzed and reported by trained professionals. Summed stress, summed rest, and summed difference scores (SSS, SRS, and SDS) were reported by two expert nuclear medicine specialists. This study was conducted under the code number IR.UMSU.REC.1399.334.
Data Analysis
The acquired data were analyzed by SPSS, version 22. Mean ± standard deviation and t-tests were used for quantitative data, while percentages and chi-square tests were employed for qualitative data. Regression models were utilized to examine the relationship between the TyG index, cardiac ischemia severity, and other cardiovascular risk factors. Parametric tests were performed for data analysis due to the normality of continuous variables.
Results
This study examined 115 patients, including 22 men (19.1%). The mean age of the patients was 53.67 ± 11.57 years. The average body mass index in male and female patients was 27.57 ± 3.84 and 29.85 ± 4.56, respectively (P = 0.033). In addition, the average TyG index in male and female patients was 8.73 ± 0.49 and 8.8 ± 0.59, respectively (P= 0.6). Of the patients, 68.7% had no ischemia, and the prevalence of mild, moderate, and severe ischemia reported by MPI was 17.7%, 10.4%, and 3.5%, respectively.
Table 1 presents the laboratory findings of the patients, and Table 2 provides the TyG index distribution according to patients’ demographic data. TyG had a significant association with the severity of ischemia reported by MPI, increasing from 8.58 ± 0.45 in non-ischemic patients to 9.6 ± 0.33 in severe ischemia.
Table 1.
Laboratory Finding of Patients According to Their Gender
|
Parameters
|
All Patients
|
Male
|
Female
|
P
Value
|
|
Mean±SD
|
Mean±SD
|
Mean±SD
|
| Fasting blood glucose |
106.58 ± 34.59 |
108.27 ± 35.95 |
106.18 ± 34.45 |
0.8 |
| Fasting triglyceride |
143.46 ± 73.1 |
128.68 ± 46.03 |
146.96 ± 75.84 |
0.28 |
| Low-density lipoprotein |
94.94 ± 29.67 |
99.5 ± 20.07 |
93.86 ± 31.5 |
0.42 |
| High-density lipoprotein |
43.56 ± 10.73 |
42.77 ± 11.43 |
43.74 ± 10.62 |
0.71 |
| White blood cell |
7121.74 ± 1140.5 |
6727.27 ± 827.03 |
7215.05 ± 1187.3 |
0.12 |
| Hemoglobin |
12.96 ± 1.15 |
14.82 ± 0.91 |
12.52 ± 0.65 |
< 0.001 |
| Platelet |
235043 ± 47450.3 |
220909 ± 45971.94 |
238387.1 ± 45971.94 |
0.12 |
| Creatinine |
1.002 ± 0.02 |
1.009 ± 0.04 |
1.0 ± 0.00 |
0.33 |
Note. SD: Standard deviation.
Table 2.
Association Between TyG Index and the Severity of Ischemia According to Demographic Findings
|
Parameters
|
Ischemia Severity
|
|
No Ischemia
|
Mild Ischemia
|
Moderate Ischemia
|
Severe Ischemia
|
P
value
|
| All patients |
|
8.58 ± 0.45 |
9.23 ± 0.51 |
9.17 ± 0.66 |
9.6 ± 0.33 |
< 0.001 |
| Gender |
Male |
8.52 ± 0.42 |
9.31 ± 0.25 |
8.87 ± 0.13 |
9.41 ± 0.11 |
0.006 |
| Female |
8.6 ± 0.45 |
9.21 ± 0.56 |
9.23 ± 0.71 |
9.66 ± 0.37 |
< 0.001 |
|
P value |
|
0.53 |
0.73 |
0.17 |
0.61 |
- |
| Age |
< 50 |
8.54 ± 0.29 |
8.94 ± 0.44 |
9.55 ± 0.81 |
9.65 ± 0.87 |
< 0.001 |
| < 50 |
8.16 ± 0.54 |
9.38 ± 0.48 |
9.98 ± 0.52 |
9.58 ± 0.39 |
< 0.001 |
|
P value |
|
0.46 |
0.06 |
0.26 |
0.89 |
- |
| Diabetes mellitus |
No |
8.55 ± 0.38 |
9.05 ± 0.36 |
9.03 ± 0.34 |
9.3 ± 0.3 |
< 0.001 |
| Yes |
8.76 ± 0.71 |
9.63 ± 0.6 |
9.45 ± 1.07 |
9.7 ± 0.32 |
0/0.64 |
|
P value |
|
0.13 |
0.015 |
0.31 |
0.39 |
- |
| BMI |
< 30 |
8.5 ± 0.48 |
9.3 ± 0.47 |
8.15 ± 0.34 |
9.35 ± 0.08 |
< 0.001 |
| < 30 |
8.71 ± 0.36 |
9.13 ± 0.54 |
9.26 ± 0.6 |
9.84 ± 0.27 |
< 0.001 |
|
P-value |
|
0.056 |
0.42 |
0.11 |
0.14 |
|
Note. BMI: Body mass index; TyG index: Triglyceride glucose index.
Table 3 lists data related to the TyG index in diabetic and non-diabetic patients and its association with SSS and SDS. Although in groups with SSS and SDS of 0, the TyG index was not different between diabetic patients and those with normal sugar values. When these scores increased above 0, the TyG index value significantly increased in diabetic patients.
Table 3.
Comparison of SSS and SDS and TyG Index Among Diabetic and Non-diabetic Patients
|
Parameters
|
All Patients
|
Diabetes
|
P
Value
|
|
Non-diabetic
|
Diabetic
|
| SSS |
0 |
8.58 ± 0.45 |
8.55 ± 0.38 |
8.76 ± 0.71 |
0.15 |
| > 0 |
9.22 ± 0.57 |
9.02 ± 0.39 |
9.59 ± 0.68 |
0.002 |
|
P value |
|
- |
< 0.001 |
007/0 |
|
| SDS |
0 |
8.58 ± 0.45 |
8.55 ± 0.38 |
8.76 ± 0.71 |
0.15 |
| > 0 |
9.25 ± 0.55 |
9.07 ± 0.34 |
9.59 ± 0.68 |
0.003 |
|
P value |
|
- |
< 0.001 |
0.007 |
|
Note. SSS: Sums stress score; SDS: Sum difference score; TyG index: Triglyceride glucose index.
Compared with those who had a lower TyG index, in patients with a higher TyG index, the chance of having an SSS and SDS above 0 increased 10-13 folds (Table 4). Receiver operating characteristic showed that a TyG index above 9.15 with a sensitivity of 68.4% and specificity of 84.2% could predict an SDS of > 0 (Figure 1).
Table 4.
Univariate and Multivariate Analyses Comparing SSS and SDS in Patients With Low and High TyG Index, Adjusted for Age, Gender, BMI, and History of Diabetes Mellitus
|
Parameters
|
Univariate Analysis
|
Multivariate Analysis
|
|
OR (95% CI)
|
P
Value
|
OR (95% CI)
|
P
Value
|
| Severity of ischemia |
Without ischemia |
1 |
- |
1 |
- |
| With ischemia |
16.53 (5.51-32.33) |
< 0.001 |
13.67 (3.48-87.25) |
< 0.001 |
| SSS |
0 |
1 |
- |
1 |
- |
| > 0 |
12.8 (4.36-43.98) |
< 0.001 |
10.97 (3.35-35.96) |
< 0.001 |
| SDS |
0 |
1 |
- |
1 |
- |
| > 0 |
16.53 (5.51-33.33) |
< 0.001 |
13.67 (3.48-87.26) |
< 0.001 |
Note. SSS: Summed stress score; SDS: Summed difference score; TyG index: Triglyceride glucose index; BMI: Body mass index; OR: Odds ratio; CI: Confidence interval.
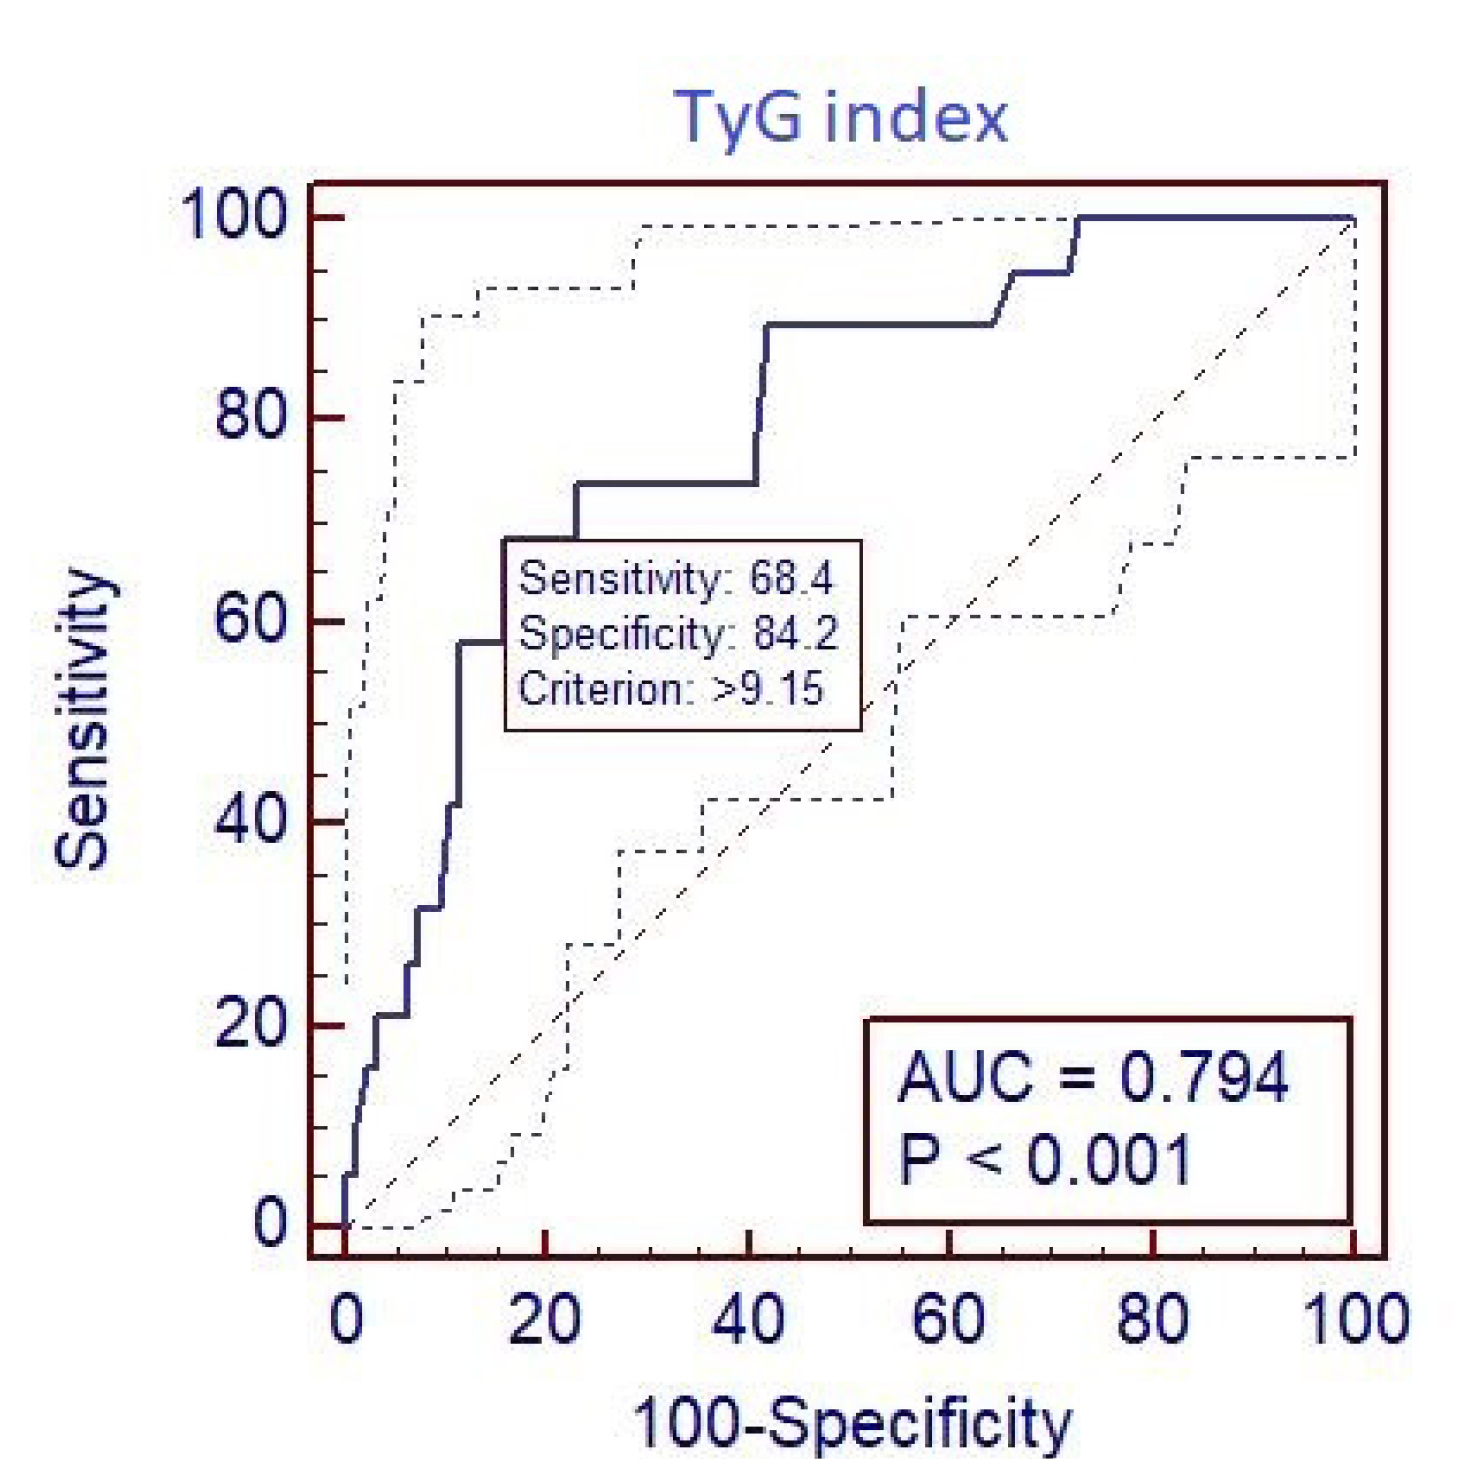
Figure 1.
Area Under Curve Showing the Relationship Between TyG Index and SDS. Note. SDS: Summed difference score; TyG index: Triglyceride glucose index
.
Area Under Curve Showing the Relationship Between TyG Index and SDS. Note. SDS: Summed difference score; TyG index: Triglyceride glucose index
Discussion
The average TyG index in patients without ischemia was lower compared to patients with ischemia (odds ratio: 10.97, 95% confidence interval: 3.35-35.96, P < 0.001). Additionally, in diabetic patients without ischemia, the TyG index was not different from that of non-diabetic patients. However, the TyG index significantly increased in diabetic patients with obstructed coronary arteries.
The exact association between triglyceride levels and ischemic heart disease is not well understood. Lipid-lowering drugs do not act on cholesterol and triglyceride reduction similarly, and the concomitant use of drugs has adverse effects on lowering each agent; thus, finding a cutoff point to treat triglyceride in CAD patients requires further investigation.10
The risk factors for having a high triglyceride level, such as obesity, metabolic syndrome, and physical inactivity, are similar to those of CAD.11 Currently, the main goal for lowering the risk of CAD remains on LDL cholesterol lowering, and triglyceride lowering is a secondary goal. Laura et al conducted a cohort study following patients for an average period of 10 years and suggested that the TyG index, which has been suggested as a marker of insulin resistance, could predict the development of cardiovascular events in the future.12 Our findings also revealed that increasing the TyG index could progressively impair cardiac tissue perfusion.
Based on the evidence, the TyG index can potentially be a biomarker indicating insulin resistance and has an important correlation with complications related to diabetes mellitus, such as nephropathy, retinopathy, and cardiovascular events.13 The results of our study demonstrated that the association between the TyG index and SSS and SDS was stronger in patients with type 2 diabetes compared to those patients who had no history of diabetes mellitus. Therefore, the TyG index can be used as a predictive value for ischemia severity, especially in diabetic patients. Interestingly, the TyG index was not different in non-diabetic compared to diabetic patients with an SSS and SDS of 0 (P= 0.15). However, in diabetic patients with an SSS and SDS > 0, the TyG index was significantly higher (P = 0.002 and P= 0.003, respectively). It seems that MPI can be utilized to detect early stages of insulin resistance damage in the heart.
Lee et al assessed the correlation between the TyG index and ischemic heart disease using computed tomography angiography in diabetic patients and found that, considering all factors with significant effects, the TyG index was an independent risk factor for ischemic heart disease in the highest tertile of the TyG index group, 14 which conforms to our findings.
Wang et al used coronary angiography to correlate the presence of coronary multi-vessel disease with the TyG index and concluded that the TyG index was an independent risk factor for multi-vessel CAD. Interestingly, unlike in pre-diabetic patients, this issue was not observed in diabetic patients.15
In a meta-analysis of previous investigations, individuals in a higher TyG index category were independently associated with developing acute myocardial ischemia, endothelial damage, ischemic heart disease, stroke, and cardiovascular disease. The correlation between the TyG index and prevalence of atherosclerotic cardiovascular diseases was not influenced by age, gender, or diabetic status.16-18 In borderline patients, using the TyG index could help physicians with better selection of patients who needed imaging studies.
Limitations
Due to the small sample size, subgroup analysis was not performed in this study. Future studies with large sample sizes could facilitate a more in-depth subgroup analysis. Conducting cohort studies and following patients with a high TyG index in the long term can enhance the generalizability of the results of this study.
Conclusions
Overall, our findings revealed that the TyG index was significantly associated with ischemia detected by MPI.
Acknowledgments
We appreciate the assistance of the Clinical Research Development Unit Of Ayatollah Taleghani Hospital.
Author contributions
Conceptualization: Reza Hajizadeh.
Data curation: Saba Maleki.
Formal analysis: Reza hajizadeh.
Methodology: Reza Hajizadeh.
Project administration: Saba Maleki.
Resources: Saba Maleki.
Supervision: Mir-Hossein Seyed-Mohammadzad.
Validation: Mir-Hossein Seyed-Mohammadzad.
Visualization: Mir-Hossein Seyed-Mohammadzad.
Writing–original draft: Reza Hajizadeh.
Writing–review & editing: Reza Hajizadeh.
Data availability statement
Data gathered for the study are available from the corresponding
author upon reasonable request.
Ethical approval
This study was approved by the the Ethics Committee of Urmia
University of Medical Sciences with the ethical approval code: IR.UMSU.REC.1399.334.
Consent for publication
None.
Conflict of interests
None declared.
References
- Nikniaz Z, Faghih Dinevari M, Mokhtari L. Association of cardiovascular disease, respiratory diseases, and diabetes treatment with COVID-19 mortality in hospitalized patients. Int J Drug Res Clin 2023; 1(1):e21. doi: 10.34172/ijdrc.2023.e21 [Crossref] [ Google Scholar]
- Abbasnezhad M, Soleimanpour H, Sasaie M, Golzari SE, Safari S, Soleimanpour M. Comparison of prediction between TIMI (thrombolysis in myocardial infarction) risk score and modified TIMI risk score in discharged patients from emergency department with atypical chest pain. Iran Red Crescent Med J 2014; 16(2):e13938. doi: 10.5812/ircmj.13938 [Crossref] [ Google Scholar]
- Mousavi SE, Fazlollahi A, Nejadghaderi SA, Aslani A, Sullman MJ, Kolahi AA. The burden of ischemic heart disease among adults 70 years and older in Iran, 1990-2019. Int J Aging 2023; 1(1):e9. doi: 10.34172/ija.2023.e9 [Crossref] [ Google Scholar]
- Mahoori A, Hajizadeh R, Ghodratizadeh S, Askari B. Effects of oropharyngeal lidocaine spray before endotracheal intubation on heart rate, blood pressure, and arrhythmia in patients undergoing coronary artery bypass grafting surgery: a randomized clinical trial. Int J Drug Res Clin 2024; 2(1):e6. doi: 10.34172/ijdrc.2024.e6 [Crossref] [ Google Scholar]
- Di Pino A, DeFronzo RA. Insulin resistance and atherosclerosis: implications for insulin-sensitizing agents. Endocr Rev 2019; 40(6):1447-67. doi: 10.1210/er.2018-00141 [Crossref] [ Google Scholar]
- Beverly JK, Budoff MJ. Atherosclerosis: pathophysiology of insulin resistance, hyperglycemia, hyperlipidemia, and inflammation. J Diabetes 2020; 12(2):102-4. doi: 10.1111/1753-0407.12970 [Crossref] [ Google Scholar]
- Rozanski A, Sakul S, Narula J, Uretsky S, Lavie CJ, Berman D. Assessment of lifestyle-related risk factors enhances the effectiveness of cardiac stress testing. Prog Cardiovasc Dis 2023; 77:95-106. doi: 10.1016/j.pcad.2023.03.004 [Crossref] [ Google Scholar]
- Tao LC, Xu JN, Wang TT, Hua F, Li JJ. Triglyceride-glucose index as a marker in cardiovascular diseases: landscape and limitations. Cardiovasc Diabetol 2022; 21(1):68. doi: 10.1186/s12933-022-01511-x [Crossref] [ Google Scholar]
- Wu Z, Liu L, Wang W, Cui H, Zhang Y, Xu J. Triglyceride-glucose index in the prediction of adverse cardiovascular events in patients with premature coronary artery disease: a retrospective cohort study. Cardiovasc Diabetol 2022; 21(1):142. doi: 10.1186/s12933-022-01576-8 [Crossref] [ Google Scholar]
-
Aberra T, Peterson ED, Pagidipati NJ, Mulder H, Wojdyla DM, Philip S, et al. The association between triglycerides and incident cardiovascular disease: what is “optimal”? J Clin Lipidol 2020;14(4):438-47.e3. doi: 10.1016/j.jacl.2020.04.009.
- Oh RC, Trivette ET, Westerfield KL. Management of hypertriglyceridemia: common questions and answers. Am Fam Physician 2020; 102(6):347-54. [ Google Scholar]
- Sánchez-Íñigo L, Navarro-González D, Fernández-Montero A, Pastrana-Delgado J, Martínez JA. The TyG index may predict the development of cardiovascular events. Eur J Clin Invest 2016; 46(2):189-97. doi: 10.1111/eci.12583 [Crossref] [ Google Scholar]
- Liu L, Xia R, Song X, Zhang B, He W, Zhou X. Association between the triglyceride-glucose index and diabetic nephropathy in patients with type 2 diabetes: a cross-sectional study. J Diabetes Investig 2021; 12(4):557-65. doi: 10.1111/jdi.13371 [Crossref] [ Google Scholar]
- Lee EY, Yang HK, Lee J, Kang B, Yang Y, Lee SH. Triglyceride glucose index, a marker of insulin resistance, is associated with coronary artery stenosis in asymptomatic subjects with type 2 diabetes. Lipids Health Dis 2016; 15(1):155. doi: 10.1186/s12944-016-0324-2 [Crossref] [ Google Scholar]
- Wang X, Xu W, Song Q, Zhao Z, Meng X, Xia C. Association between the triglyceride-glucose index and severity of coronary artery disease. Cardiovasc Diabetol 2022; 21(1):168. doi: 10.1186/s12933-022-01606-5 [Crossref] [ Google Scholar]
- Liang S, Wang C, Zhang J, Liu Z, Bai Y, Chen Z. Triglyceride-glucose index and coronary artery disease: a systematic review and meta-analysis of risk, severity, and prognosis. Cardiovasc Diabetol 2023; 22(1):170. doi: 10.1186/s12933-023-01906-4 [Crossref] [ Google Scholar]
- Liu X, Tan Z, Huang Y, Zhao H, Liu M, Yu P. Relationship between the triglyceride-glucose index and risk of cardiovascular diseases and mortality in the general population: a systematic review and meta-analysis. Cardiovasc Diabetol 2022; 21(1):124. doi: 10.1186/s12933-022-01546-0 [Crossref] [ Google Scholar]
- Ding X, Wang X, Wu J, Zhang M, Cui M. Triglyceride-glucose index and the incidence of atherosclerotic cardiovascular diseases: a meta-analysis of cohort studies. Cardiovasc Diabetol 2021; 20(1):76. doi: 10.1186/s12933-021-01268-9 [Crossref] [ Google Scholar]