Int J Aging. 2024;2:e12.
doi: 10.34172/ija.2024.e12
Original Article
Burden of Chronic Kidney Disease for Adults 70 Years and Older in Iran During 1990-2021
Ali Shamekh 1  , Fateme Tahmasbi 1, Seyed Ehsan Mousavi 2, Aria Nejadghaderi 3, 4, Mark J. M. Sullman 5, 6, Ali-Asghar Kolahi 7, *
Author information:
1Social Determinants of Health Research Center, Tabriz University of Medical Sciences, Tabriz, Iran
2Neurosciences Research Center, Aging Research Institute, Tabriz University of Medical Sciences, Tabriz, Iran
3HIV/STI Surveillance Research Center, and WHO Collaborating Center for HIV Surveillance, Institute for Futures Studies in Health, Kerman University of Medical Sciences, Kerman, Iran
4Systematic Review and Meta-analysis Expert Group (SRMEG), Universal Scientific Education and Research Network (USERN), Tehran, Iran
5Department of Life and Health Sciences, University of Nicosia, Nicosia, Cyprus
6Department of Social Sciences, University of Nicosia, Nicosia, Cyprus
7Social Determinants of Health Research Center, Shahid Beheshti University of Medical Sciences, Tehran, Iran
Abstract
Objectives:
To report the burden of chronic kidney disease (CKD) among those aged 70 and above in Iran by age, sex, and province from 1990 to 2021.
Design:
Systematic analysis.
Outcome measures:
Data were obtained from the Global Burden of Disease study 2021. All estimates were reported as counts and age-standardized rates per 100000 individuals, with their corresponding 95% uncertainty intervals (UIs).
Results:
In 2021, CKD recorded an age-standardized prevalence of approximately 44 thousand per 100000 population among adults 70 years and older in Iran (95% UI: 39807–47784.5 per 100000). This rate meant a 5% increase compared to 1990, which was statistically significant. CKD also accounted for 8,725 deaths in the elderly population of Iran in 2021. Furthermore, disability-adjusted life years (DALY) rates were 3697.7 per 100000 population and had a 28.2% increase in the span of 1990–2021. Fars and Chahar Mahaal and Bakhtiari had the highest and lowest point prevalence per 100000 at 50357.2 and 40453.9, respectively, in the elderly population. In 2021, the prevalence, deaths, and DALYs due to CKD did not differ significantly between the two sexes, although the numbers were slightly higher in the female population. Moreover, the age-standardized prevalence, deaths, and DALYs of CKD in the elderly of Iran in 2021 started to rise in the 70–74 and increased with aging.
Conclusions:
The burden of CKD in the elderly of Iran has increased over the past 30 years. This is in line with the increase in the elderly population and the rising of its related risk factors. Preemptive measures, public knowledge raising, and the implementation of risk management policies can brighten the future of Iran’s elderly population in terms of non-communicable diseases, especially CKD.
Keywords: Chronic kidney disease, Burden of disease, Iran, Epidemiology, Mortality, Prevalence, Disability-adjusted life years
Copyright and License Information
© 2024 The Author(s).
This is an open access article distributed under the terms of the Creative Commons Attribution License (
http://creativecommons.org/licenses/by/4.0/), which permits unrestricted use, distribution, and reproduction in any medium, provided the original work is properly cited.
Funding Statement
The Bill and Melinda Gates Foundation, not involved in any way in the preparation of this manuscript, funded the GBD study. Shahid Beheshti University of Medical Sciences (Grant No. 24279) supported the present report.
Please cite this article as follows: Shamekh A, Tahmasbi F, Mousavi SE, Nejadghaderi A, Sullman MJM, Kolahi AA. Burden of chronic kidney disease for adults 70 years and older in Iran during 1990-2021. Int J Aging. 2024;2: e12. doi: 10.34172/ija.2024.e12
Introduction
Chronic kidney disease (CKD) refers to a prevalent, non-communicable medical condition characterized by the gradual and irreversible loss of renal function.1 The pathophysiology of this condition involves a complex interplay of various mechanisms that contribute to the glomerulosclerosis and/or interstitial fibrosis that develop as the condition advances.2 In 2017, a global burden of disease (GBD) investigation estimated that the global prevalence of CKD was 700 million with a mortality rate of 1.2 million.3 An increased rate was recorded in global CKD-related mortality (41.5%) and the global all-age prevalence (29.3%) since 1990.3 According to a GBD 2019 study, the deaths and disability-adjusted life-years (DALYs) due to CKD showed a 101.1% and 81.7% increase, respectively, in the span of 1990–2019.4 Moreover, in the Middle East and North Africa region, the age-standardized incidence rate of CKD had an increase of more than 70% from 1990 to 2019, signifying the rising burden of CKD in this region.5
A significant burden is attributed to CKD on both individual and systemic levels. First, its incidence has been steadily increasing, mainly due to the rising prevalence of risk factors such as diabetes, hypertension, and aging populations.6 Second, the progression of CKD can also lead to extra-renal and systemic conditions, including cardiovascular complications,7 electrolyte imbalances,8 mineral and bone disorders,9 anemia,10 and immune dysfunction.11 These CKD-related health complications and comorbidities further contribute to its burden. Third, CKD can significantly impact an individual’s quality of life, leading to physical impairment, psychological distress, and limitations in activities of daily living.12-14 In addition to the individual level, it imposes a significant economic burden on healthcare systems and societies.15 The costs associated with CKD care, including direct medical expenses and indirect costs such as productivity losses, can be significant.16,17 Although many countries and insurances cover the dialysis fees, and renal replacement therapies are almost cost-free, most other medications (e.g., supplements, conservative care, hypertension, and diabetes care), routine clinical visits, and out-of-pocket costs can be devastating to patients and healthcare systems.18,19 According to an Iranian study in 2020, the annual costs of hemodialysis, peritoneal dialysis, and kidney transplantation were approximately $13500, $1300, and $16500, respectively.20
On the other hand, CKD poses additional challenges to low-to-middle income countries due to their unique background and regional difficulties, including limited access to healthcare, a high prevalence of risk factors, environmental factors such as inadequate sanitation, and limited resources for CKD management.21,22 According to the GBD 2019 data, low-income countries had the highest DALY rates per 100 000 population, and these rates increased with population aging.23 Furthermore, based on previous data, countries with a lower socio-demographic index are more prone to higher prevalence, deaths, and DALYs due to CKD.4 Hence, investigating the burden of CKD in these countries needs further focus for informing public health strategies and promoting equity in healthcare.
Aside from the aforementioned challenges, Iran, a Middle Eastern country, has faced significant changes in its population’s composition, such as a rise in the prevalence of the elderly and an increase in life expectancy.24 This demographic transition has brought forth a growing need to address the health challenges faced by older adults, with CKD being one of the most pressing concerns. Older age was regarded as one of the main risk factors of CKD based on a CKD Epidemiology Collaboration and Modification of Diet in Renal Disease study in Iran.25 Further, these equations yielded 43.84 (95% confidence interval: 39.49–48.66) and 55.80 (95% confidence interval: 50.29–61.91) incidence rates for CKD per 1000 person-years.25
Despite the growing recognition of CKD as a significant public health issue, there remains a limited understanding of the burden of the elderly population in Iran. By examining the burden of CKD among adults aged 70 years and older over 30 years (from 1990 to 2021), this research seeks to fill this knowledge gap and shed light on the magnitude and trends of CKD in this specific age group.
Methods
Overview
GBD 2021 evaluated 371 diseases and injuries in 21 regions, seven super-regions, and 204 territories and countries from 1990 to 2021.26 The current study provided data on the prevalence, deaths, and DALYs attributable to CKD in Iran as well as its 31 provinces from 1990 to 2021. GBD 2021 approach and progress since GBD 2019 can be found elsewhere.26 Fatal and non-fatal estimates can be obtained from https://vizhub.healthdata.org/gbd-compare/ and http://ghdx.healthdata.org/gbd-results-tool.
Case Definition and Data Sources
CKD is defined as a permanent loss of kidney function as indicated by the estimated glomerular filtration rate and urinary albumin to creatinine ratio. The CKD Epidemiology Collaboration estimated glomerular filtration rate equation and the Schwartz equation are considered our gold standard for those 18 years or older and those younger than 18 [the equations are accessible on https://www.healthdata.org/gbd/methods-appendices-2021/chronic-kidney-disease-0], respectively. The GBD study considers six stages of CKD as defined by the degree of loss of kidney function or receipt of kidney replacement therapy. These definitions of the six stages are presented in Table S1. The ICD-10 codes associated with CKD include N18.1-N18.9. Moreover, the clinical case definition for CKD is a chronic, progressive condition of the kidney lasting 3 months or more, with a loss in its key function to filtrate blood to produce urine.
Throughout GBD 2021, the Institute for Health Metrics and Evaluation (IHME) opportunistically updated scientific literature extractions from the Global Health Data Exchange (GHDx). Literature extractions were augmented by the identification of population-based surveys that measured kidney function. In addition, ERA-EDTA (European Renal Association - European Dialysis and Transplant Association) from 1998–2017 was re-extracted due to insufficient GBD 2019 etiology models.
Furthermore, vital registration and verbal autopsy data were used to model mortality due to CKD. Data were standardized and mapped according to the GBD causes of death ICD mapping method. These data were then age-sex split, and appropriate redistribution of garbage code data was performed. Datapoints that violated well-established age or time trends or that resulted in extremely high or low cause fractions were marked as outliers and excluded from the investigation.
Data Processing and Disease Models
Non-fatal Modelling Strategy
To obtain an appropriate age pattern to age-split input data, IHME first ran a disease model—Bayesian meta-regression 1 (DisMod-MR 2.1) for all datapoints with an age range of less than 30 years. In GBD 2019, the estimated age pattern was created using all data with an age range of less than 50. IHME changed this age range to less than 30 for GBD 2021 because, for example, a 40-year range is uninformative for the overall age pattern. However, after re-evaluation, IHME determined that since DisMod-MR 2.1 depends on rates rather than case numbers, these less than one case number can be handled reasonably within DisMod-MR 2.1. Thus, data restriction was removed, and these datapoints were allowed to be age-split. Then, the age pattern was used by the super-region to age-split dialysis and transplant input data, thereby allowing for variations in the age pattern by location. After age-splitting, a model was run on all processed data, including age-split and age-specific data, to obtain final estimates of dialysis incidence and prevalence by location, year, age, and sex. For dialysis, remission data for dialysis were calculated as the ratio of the incidence of kidney transplantation to the prevalence of dialysis at the sex-, age-, and country-matched levels. A similar process occurs for stages 3 and 4 remission, where remission data for the respective stages are calculated as the ratio of the incidence of the later stage to the prevalence of the stage of interest at the sex-, age-, and country-matched levels. For the other stage models (Stages 1–2, Stage 3, Stage 4, and Stage 5), these models’ age splits and age patterns are determined by DisMod-MR 2.1.
In general, IHME runs separate DisMod-MR 2.1 models for each stage of CKD and an aggregate CKD stage 3–5 model to produce estimates by age, sex, year, and country. The stage 3–5 model is used as an envelope to ensure that the stage-level models are consistent. CKD stage models 3, 4, and 5 were then rescaled to the aggregate stage 3–5 model for every age, sex, year, and country.
Fatal Modelling Strategy
No substantive changes were made in the modelling strategy from GBD 2019 for fatal CKD. A standard cause-of-death ensemble model with location-level covariates was employed to model deaths due to CKD. The excess mortality rate (EMR) strategy from GBD 2019 utilized cause-specific mortality rate (CSMR) along with prevalence to inform the DisMod-MR 2.1 EMR estimates. This method assumes that CSMR represents excess deaths due to a cause. Accordingly, for CKD, CSMR captures deaths due to CKD as the primary cause of death. Upon further examination, since CKD increases the risk of death due to many comorbidities (heart disease, diabetes, and the like), the CSMR does not accurately represent all excess deaths due to CKD. Thus, IHME removed this modelled EMR approach in GBD 2021 and reverted to using DisMod MR 2.1 estimated excess mortality. Overall, this led to lower prevalence and incidence curves.
Disability Weight and Severity Distribution
Estimates of prevalence and incidence were split using CKD etiology proportion models, resulting in CKD estimates by stage and etiology. Then, a portion of each etiology split for CKD stages 3, 4, and 5 was attributed to a disability weight associated with mild, moderate, or severe anemia. For GBD 2021, each etiology split for stage 5 was attributed to a disability weight associated with mild, moderate, or severe heart failure.
Compilation of Results
For every estimate of prevalence, death, or DALY, 1000 draws were sampled, and for all intermediate calculations, the draws were summed across age, cause, and location.26 This allowed us to capture and transmit uncertainty throughout all computations. The 95% uncertainty intervals (UIs) were generated by utilizing the 2.5th and 97.5th percentiles of the sorted drawings. Moreover, age was divided into six categories (70–74, 75–79, 80–84, 85–89, 90–94, and 95 plus). The R program (version 3.5.2) was utilized to generate plots for the age-standardized point prevalence, deaths, and DALY rates. Smoothing splines models were used to investigate what relationship the socio-demographic index has with the burden of CKD in each country of MENA.
Results
National Level
In 2021, CKD accounted for 1.6 million prevalent cases (95% UI: 1.4–1.7 million) in the 70 + age group of Iran, with an age-standardized rate (ASR) of approximately 44 thousand per 100 000 population (95% UI: 39807–47784.5 per 100 000). The ASR of prevalence increased up to 5% in Iran (95% UI: 1.9%–8.5%) from 1990 to 2021, which was statistically significant (Tables 1 and S2). Furthermore, in 2021, solely in the 70 + age group, 8,725 deaths were reported due to CKD in Iran, with an ASR of 238.9 per 100 000 population (95% UI: 187.8–268.8). There was a 49.9% increase in the ASR of deaths from 1990 to 2021 in Iran, but this change was not statistically significant (95% UI: -4%–90.6%, Tables 1 and S3). In the case of DALYs, there were a total of 135 thousand DALYs reported in 2021 in Iran (95% UI: 110–150 thousand), with an ASR of 3697.7 per 100 000 population (95% UI: 3038.1–4119.8). Similar to death rates, the ASR of DALYs did not change significantly from 1990 to 2021 but showed a 28.2% increase in the mentioned timespan (95% UI: -12.2–56.5, Tables 1 and S4).
Table 1.
Prevalence, Deaths, and DALYs for CKD in Adults 70 Years and Older in Iran for Both Sexes in 2021 and the Percentage Change in the Age-standardized Rates in 1990-2021
|
|
Prevalence (95% UI)
|
Deaths (95% UI)
|
DALYs (95% UI)
|
Counts
(2021)
|
Rate
(2021)
|
Pcs in rate
1990-2021
|
Counts
(2021)
|
Rate
(2021)
|
Pcs in rate
1990-2021
|
Counts
(2021)
|
Rate
(2021)
|
Pcs in rate
1990-2021
|
| Iran |
1602875
(1453618, 1744928) |
43894.4
(39807, 47784.5) |
5
(1.9, 8.5) |
8725
(6859, 9815) |
238.9
(187.8, 268.8) |
49.9
(-4, 90.6) |
135028
(110941, 150441) |
3697.7
(3038.1, 4119.8) |
28.2
(-12.2, 56.5) |
| Alborz |
42492
(38188, 46772) |
40576.6
(36466.9, 44663.4) |
3
(-1.1, 7.2) |
204
(153, 252) |
195.1
(145.7, 240.7) |
61.6
(-16.5, 141.2) |
3466
(2726, 4181) |
3309.5
(2603.4, 3992.2) |
35.8
(-23.6, 91.5) |
| Ardebil |
25290
(22799, 27613) |
43175.7
(38921.7, 47140.2) |
6.5
(1.9, 11.5) |
169
(122, 201) |
289
(208.8, 342.4) |
77.2
(-5.1, 152.7) |
2581
(1920, 3013) |
4406
(3278, 5143.5) |
51.6
(-13.2, 106.8) |
| Bushehr |
15960
(14378, 17488) |
40840.8
(36792.5, 44751.5) |
1.4
(-2.8, 5.7) |
75
(59, 91) |
191.8
(149.8, 232.9) |
37.9
(-22.1, 96) |
1246
(1000, 1486) |
3187.3
(2560.1, 3803.5) |
24.7
(-21.4, 66.3) |
| Chahar Mahaal and Bakhtiari |
16581
(15011, 18150) |
40453.9
(36623.5, 44282) |
5.4
(0.7, 10.1) |
59
(42, 71) |
143.9
(101.6, 173) |
17.8
(-27.2, 59.5) |
978
(745, 1140) |
2386.3
(1816.8, 2780.3) |
2.6
(-29.1, 32.4) |
| East Azarbayejan |
79066
(71489, 86416) |
42938.5
(38823.6, 46930) |
3.7
(-0.6, 8.2) |
641
(428, 764) |
347.9
(232.5, 414.9) |
55.3
(-13.6, 121.2) |
9622
(6763, 11390) |
5225.3
(3673, 6185.6) |
41.2
(-15.3, 92.3) |
| Fars |
111476
(101363, 121770) |
50357.2
(45788.9, 55007.3) |
9.3
(4.5, 14.3) |
505
(387, 615) |
228
(175, 277.8) |
67.6
(7.1, 133.5) |
7916
(6384, 9409) |
3576.1
(2883.7, 4250.2) |
38
(-1, 82.6) |
| Gilan |
63921
(57790, 69548) |
41656
(37660.5, 45322.7) |
3.7
(-0.7, 8.8) |
371
(283, 442) |
241.7
(184.4, 287.9) |
68.8
(-2, 144.6) |
5727
(4556, 6734) |
3732.4
(2969, 4388.4) |
45.3
(-6.8, 96.3) |
| Golestan |
33478
(30419, 36393) |
48956.2
(44482.6, 53219.6) |
3.6
(-1.6, 8.5) |
182
(142, 213) |
266.6
(207.3, 310.9) |
70
(-0.3, 137.8) |
2973
(2396, 3437) |
4347.6
(3503.6, 5026.7) |
41.7
(-10.6, 90.5) |
| Hamadan |
40165
(36426, 43887) |
41507.7
(37643.7, 45354.3) |
6.6
(1, 12.5) |
186
(143, 227) |
192.2
(147.5, 234.2) |
55.6
(-5.7, 116) |
2971
(2396, 3605) |
3070.2
(2476.1, 3725.2) |
30.1
(-13.5, 67.8) |
| Hormozgan |
22449
(20175, 24625) |
42553.6
(38242.6, 46679.3) |
2.9
(-1.6, 7.2) |
162
(90, 202) |
306.9
(171.5, 383.3) |
33.7
(-19.8, 89.4) |
2406
(1456, 2956) |
4561.5
(2759.5, 5603.5) |
15.8
(-22.5, 55.7) |
| Ilam |
9687
(8714, 10681) |
42363.7
(38104.7, 46708.2) |
2.5
(-1.4, 6.5) |
90
(46, 107) |
391.6
(201.4, 466.9) |
63
(-10, 123.1) |
1319
(730, 1555) |
5767.3
(3190.2, 6800.3) |
45.6
(-9.5, 93.4) |
| Isfahan |
116677
(103980, 128987) |
45574.3
(40614.7, 50382.8) |
0.9
(-4.8, 6.5) |
551
(417, 675) |
215.4
(163, 263.5) |
61.8
(-4.7, 132) |
8430
(6619, 10155) |
3292.8
(2585.3, 3966.7) |
36.2
(-11.2, 87.8) |
| Kerman |
47879
(43200, 52578) |
42557.6
(38398.8, 46734.2) |
5.1
(0, 9.6) |
320
(221, 386) |
284.2
(196.3, 342.7) |
49.1
(-3.4, 111.8) |
4793
(3522, 5710) |
4259.9
(3130.8, 5075) |
22.3
(-17.1, 66.3) |
| Kermanshah |
40922
(36457, 44799) |
41818.8
(37255.8, 45780.4) |
5.2
(0.7, 10.4) |
231
(175, 277) |
236.3
(179, 282.7) |
38.2
(-9.2, 92.8) |
3610
(2831, 4281) |
3688.6
(2893.1, 4375) |
18.3
(-17.1, 58.3) |
| Khorasan-e-Razavi |
108468
(97130, 119471) |
40673.9
(36422.5, 44800) |
5.4
(0.3, 10.8) |
693
(531, 849) |
259.8
(199.1, 318.2) |
44.7
(-14.5, 110.7) |
10798
(8654, 12964) |
4049.2
(3245.3, 4861.4) |
22.2
(-21.4, 68.2) |
| Khuzestan |
70397
(63629, 76723) |
42755
(38644.7, 46597.1) |
2.6
(-1.1, 6.6) |
319
(243, 396) |
194
(147.3, 240.5) |
44.4
(-17.4, 113.6) |
5266
(4275, 6432) |
3198.5
(2596.6, 3906.5) |
28.6
(-17.8, 75.6) |
| Kohgiluyeh and Boyer-Ahmad |
11312
(10199, 12280) |
40966.8
(36937.9, 44474) |
4.6
(0, 9.7) |
45
(34, 55) |
162.4
(123.5, 199.1) |
56.2
(-11.6, 131.5) |
716
(574, 851) |
2592.7
(2079.6, 3080.8) |
30.2
(-16.2, 78.6) |
| Kurdistan |
32715
(29529, 35696) |
42011.7
(37920.9, 45840) |
4.8
(0.3, 9.9) |
165
(117, 202) |
212.1
(150.6, 259.6) |
28
(-16.5, 75.6) |
2616
(1999, 3118) |
3359.4
(2567.3, 4003.9) |
11.4
(-23.7, 48.3) |
| Lorestan |
29389
(26502, 32161) |
40992.6
(36965.2, 44858.6) |
3.6
(-1, 8.1) |
145
(109, 173) |
202.5
(151.7, 241.7) |
28.7
(-35.3, 86.5) |
2350
(1862, 2768) |
3278.1
(2596.5, 3860.9) |
13.8
(-37.2, 56.3) |
| Markazi |
36571
(32992, 40022) |
43241.6
(39010.2, 47322.1) |
6.6
(1, 12.4) |
217
(155, 263) |
256.8
(183.5, 311.2) |
38
(-8.2, 87.1) |
3217
(2444, 3806) |
3804.3
(2890.2, 4500.7) |
18.1
(-15.6, 54.5) |
| Mazandaran |
76978
(69543, 83881) |
42035.8
(37975.3, 45805.1) |
4.3
(-0.1, 8.9) |
377
(294, 461) |
205.8
(160.6, 251.8) |
68.3
(-2.8, 135.5) |
6032
(4971, 7204) |
3294
(2714.7, 3934.1) |
43.5
(-8.8, 90.2) |
| North Khorasan |
14947
(13532, 16337) |
42230.2
(38233.9, 46157.9) |
6.2
(1.5, 11.4) |
85
(65, 102) |
240.3
(184.9, 289.2) |
48
(-12.2, 103.2) |
1368
(1129, 1616) |
3866.2
(3189.4, 4566.1) |
25
(-19.5, 66.8) |
| Qazvin |
22717
(20518, 24895) |
41733.3
(37694.1, 45735.5) |
5.4
(0.1, 10.5) |
127
(93, 160) |
234.1
(170.4, 293.7) |
53.9
(-9.9, 113.3) |
1995
(1541, 2442) |
3665.5
(2831.1, 4486.8) |
29.8
(-19.8, 72.1) |
| Qom |
20875
(18869, 22795) |
41703.2
(37696.3, 45539.7) |
2.5
(-2, 7.4) |
141
(93, 172) |
281.8
(185.2, 343.7) |
27.3
(-18.1, 72.7) |
2111
(1504, 2554) |
4216.6
(3004.8, 5102.4) |
13.1
(-22.6, 49.6) |
| Semnan |
14651
(13294, 15960) |
42123.9
(38220.9, 45885.5) |
3.8
(-0.7, 8.7) |
88
(63, 108) |
251.8
(179.8, 311.4) |
44.5
(-12.6, 106) |
1354
(1022, 1651) |
3893.1
(2939.8, 4745.9) |
23.4
(-20.3, 67.9) |
| Sistan and Baluchistan |
30008
(27038, 32756) |
43409.9
(39112.2, 47384.3) |
5.6
(1, 11.2) |
266
(110, 330) |
384.9
(159.2, 477.6) |
33.5
(-5.9, 77) |
4117
(1909, 4987) |
5956
(2761.6, 7213.6) |
15.7
(-12.9, 52) |
| South Khorasan |
17450
(15816, 18989) |
42348.7
(38382.8, 46083.9) |
6.4
(1.3, 11.3) |
101
(76, 126) |
245.3
(183.4, 306.8) |
53.3
(-11.9, 123.7) |
1531
(1210, 1856) |
3716
(2936.9, 4503.1) |
28.7
(-18.5, 77.3) |
| Tehran |
359619
(326614, 391319) |
47184.1
(42853.7, 51343.4) |
4.8
(0.1, 9.1) |
1677
(1281, 2064) |
220
(168.1, 270.9) |
51.4
(-14.6, 111.6) |
25352
(20171, 30420) |
3326.4
(2646.5, 3991.3) |
27.6
(-20.8, 71.9) |
| West Azerbaijan |
49353
(44727, 54059) |
41269.5
(37401.1, 45204.6) |
3.5
(-0.8, 8.1) |
291
(226, 354) |
243.5
(188.6, 295.7) |
39.6
(-20.4, 98.4) |
4484
(3584, 5408) |
3749.8
(2996.7, 4522) |
26.3
(-19.6, 69.9) |
| Yazd |
19578
(17720, 21381) |
41844.3
(37874.3, 45698.8) |
4.7
(0, 9.6) |
122
(92, 147) |
261.2
(197, 314.7) |
64.5
(-13.6, 139.4) |
1855
(1451, 2202) |
3964.9
(3101.8, 4706.8) |
38.6
(-16.7, 91.8) |
| Zanjan |
21804
(19723, 23697) |
41564.1
(37597.3, 45171.1) |
5.5
(0.8, 11.1) |
119
(81, 142) |
226.4
(155.2, 270.8) |
68.7
(1.6, 127.8) |
1826
(1348, 2144) |
3480.9
(2569.7, 4086.3) |
39.1
(-8.9, 80.3) |
Provincial Level
At the provincial level, Isfahan [116 thousand (95% UI: 104–129 thousand)], Fars [111 thousand (95% UI: 101–121 thousand)], and Khorasan-e-Razavi [108 thousand (95% UI: 97–119 thousand)] had the highest prevalent cases of CKD in 2021 among the elderly population (aged ≥ 70), while the lowest prevalent cases were found in Ilam [9.6 thousand (95% UI: 8.7–10.6 thousand)], Kohgiluyeh and Boyer-Ahmad [11.3 thousand (95% UI: 10.1–12.2 thousand)], and Semnan [14.6 thousand (95% UI: 13.2–15.9 thousand)]. In 2021, the ASR of prevalence was the highest in Fars [50357.2 (95% UI: 45788.9–55007.3)], Golestan [48956.2 (95% UI: 44482.6–53219.6)], and Tehran [47184.1 (95% UI: 42853.7–51343.4)], whereas it had the lowest rate in Chahar Mahaal and Bakhtiari [40453.9 (95% UI: 36623.5–44282)], Khorasan-e-Razavi [40673.9 (95% UI: 36422.5–44800)], and Alborz [40576.6 (95% UI: 36466.9–44663.4)] in Iran’s elderly population (Figure 1A and Table S2). Overall, 17 provinces in Iran experienced significant increases in their ASR of prevalence from 1990 to 2021, from which Fars [9.3% (95% UI: 4.5–14.3%)], Hamadan [6.6% (95% UI: 1–12.5%)], and Markazi [6.6% (95% UI: 1–12.4%)] had the highest changes. Furthermore, the ASR prevalence of CKD per 100 000 population was significantly higher in the female population of Fars; no other provinces demonstrated a significant difference in point prevalence between sexes (Figure S1).
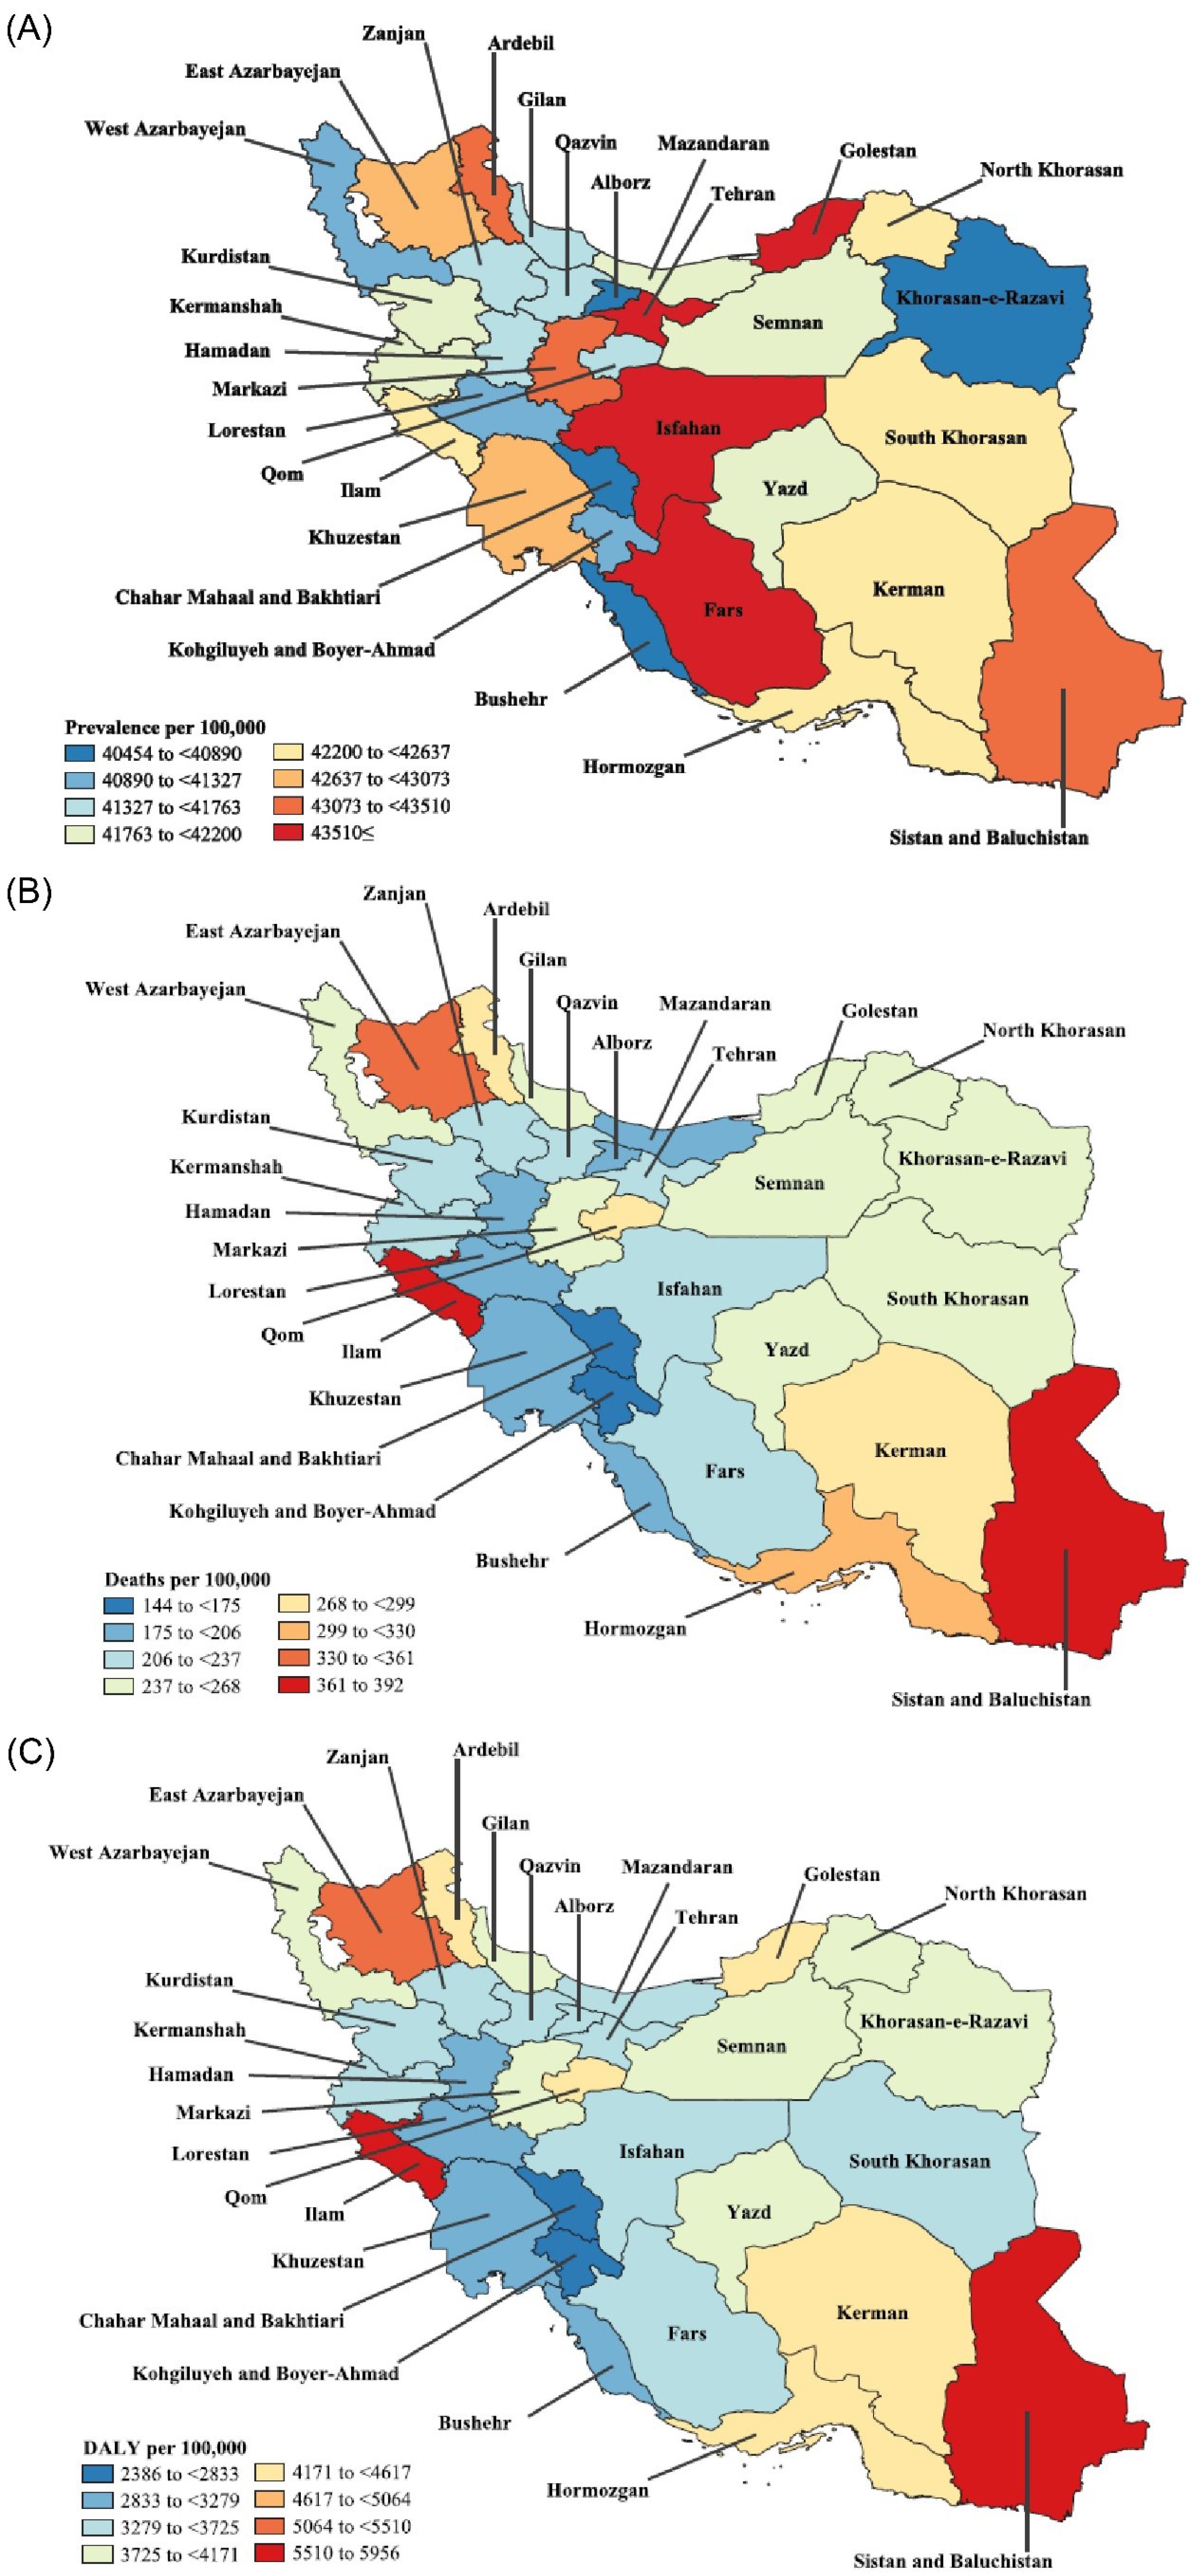
Figure 1.
(A) Point Prevalence, (B) Deaths, and (C) DALY Rates for CKD (per 100 000 Population) for Adults 70 Years and Older in Iran in 2021 by Province. Note. DALY: Disability-adjusted life years; CKD: Chronic kidney disease. Source. Generated from data available from http://ghdx.healthdata.org/gbd-results-tool.
.
(A) Point Prevalence, (B) Deaths, and (C) DALY Rates for CKD (per 100 000 Population) for Adults 70 Years and Older in Iran in 2021 by Province. Note. DALY: Disability-adjusted life years; CKD: Chronic kidney disease. Source. Generated from data available from http://ghdx.healthdata.org/gbd-results-tool.
In the ≥ 70 population of Iran’s provinces in 2021, Tehran [1677 (95% UI: 1281–2064)], Khorasan-e-Razavi [693 (95% UI: 531–849)], and East Azerbaijan [641 (95% UI: 428–764)] had the highest deaths due to CKD, while Kohgiluyeh and Boyer-Ahmad [45 (95% UI: 34–55)], Chahar Mahaal and Bakhtiari [59 (95% UI: 42–71)], and Bushehr [75 (95% UI: 59–91)] had the lowest numbers. The ASR of deaths per 100 000 of Iran’s ≥ 70 population due to CKD was the highest in Ilam [391.6 (95% UI: 201.4–466.9)], Sistan and Baluchistan [384.9 (95% UI: 159.2–477.6)], and East Azerbaijan [347.9 (95% UI: 232.5–414.9)]; however, this rate was the lowest in Chahar Mahaal and Bakhtiari [143.9 (95% UI: 101.6–173)], Kohgiluyeh and Boyer-Ahmad [162.4 (95% UI: 123.5–199.1)], and Bushehr [191.8 (95% UI: 149.8–232.9)], the details of which are shown in Figure 1B and Table S3. Only two provinces showed statistically significant changes from 1990 to 2021 regarding their ASR of deaths, including Zanjan [68.7% (95% UI: 1.6%–127.8%)] and Fars [67.6% (95% UI: 7.1–133.5%)]. Based on the results, no significant differences in the ASR of deaths were observed between sexes among the Iranian provinces in 2021 (Figure S2).
Finally, among the Iranian’s elderly population in 2021, the highest DALYs due to CKD were found in Tehran [25352 (95% UI: 20171–30420)], Khorasan-e-Razavi [10798 (95% UI: 8654–12964)], and East Azarbayejan [9622 (95% UI: 6763–11390)], while the lowest numbers were noted in Kohgiluyeh and Boyer-Ahmad [716 (95% UI: 574–851)], Chahar Mahaal and Bakhtiari [978 (95% UI: 745–1140)], and Bushehr [1246 (95% UI: 1000–1486)]. The ASR of DALYs due to CKD in 2021 in Iran (aged more than 70 years old) was the highest in Sistan and Baluchistan [5956 (95% UI: 2761.6–7213.6)], Ilam [5767.3 (95% UI: 3190.2–6800.3)], and East Azarbayejan [5225.3 (95% UI: 3673–6185.6)], whereas the lowest rate belonged to Chahar Mahaal and Bakhtiari [2386.3 (95% UI: 1816.8–2780.3)], Kohgiluyeh and Boyer-Ahmad [2592.7 (95% UI: 2079.6–3080.8)], and Hamadan [3070.2 (95% UI: 2476.1–3725.2)], the results of which are provided in Figure 1C and Table S4. No provinces in Iran revealed significant changes in their respective ASR of DALYs due to CKD from 1990 to 2021. Additionally, there were no significant differences between men and women among the provinces of Iran regarding their ASR of DALYs in 2021 (Figure S3).
Age and Sex Patterns
In 2021, the prevalence, deaths, and DALYs due to CKD did not differ significantly between the two sexes, although the numbers were slightly higher in the female population. The total prevalent cases were the highest among the 70–74 age group and declined with aging. On the other hand, the ASR of prevalence per 100 000 population increased with a linear pattern as the population aged, peaking at the 95 + age group (Figure 2A). Although both the prevalent cases and rates were higher in women compared to men (men had only higher prevalent cases in the 90 + age group), these differences were not statistically significant. Furthermore, there were no significant changes in the prevalence rates of CKD of both sexes among the Iranian provinces from 1990 to 2021 (Figure S4).
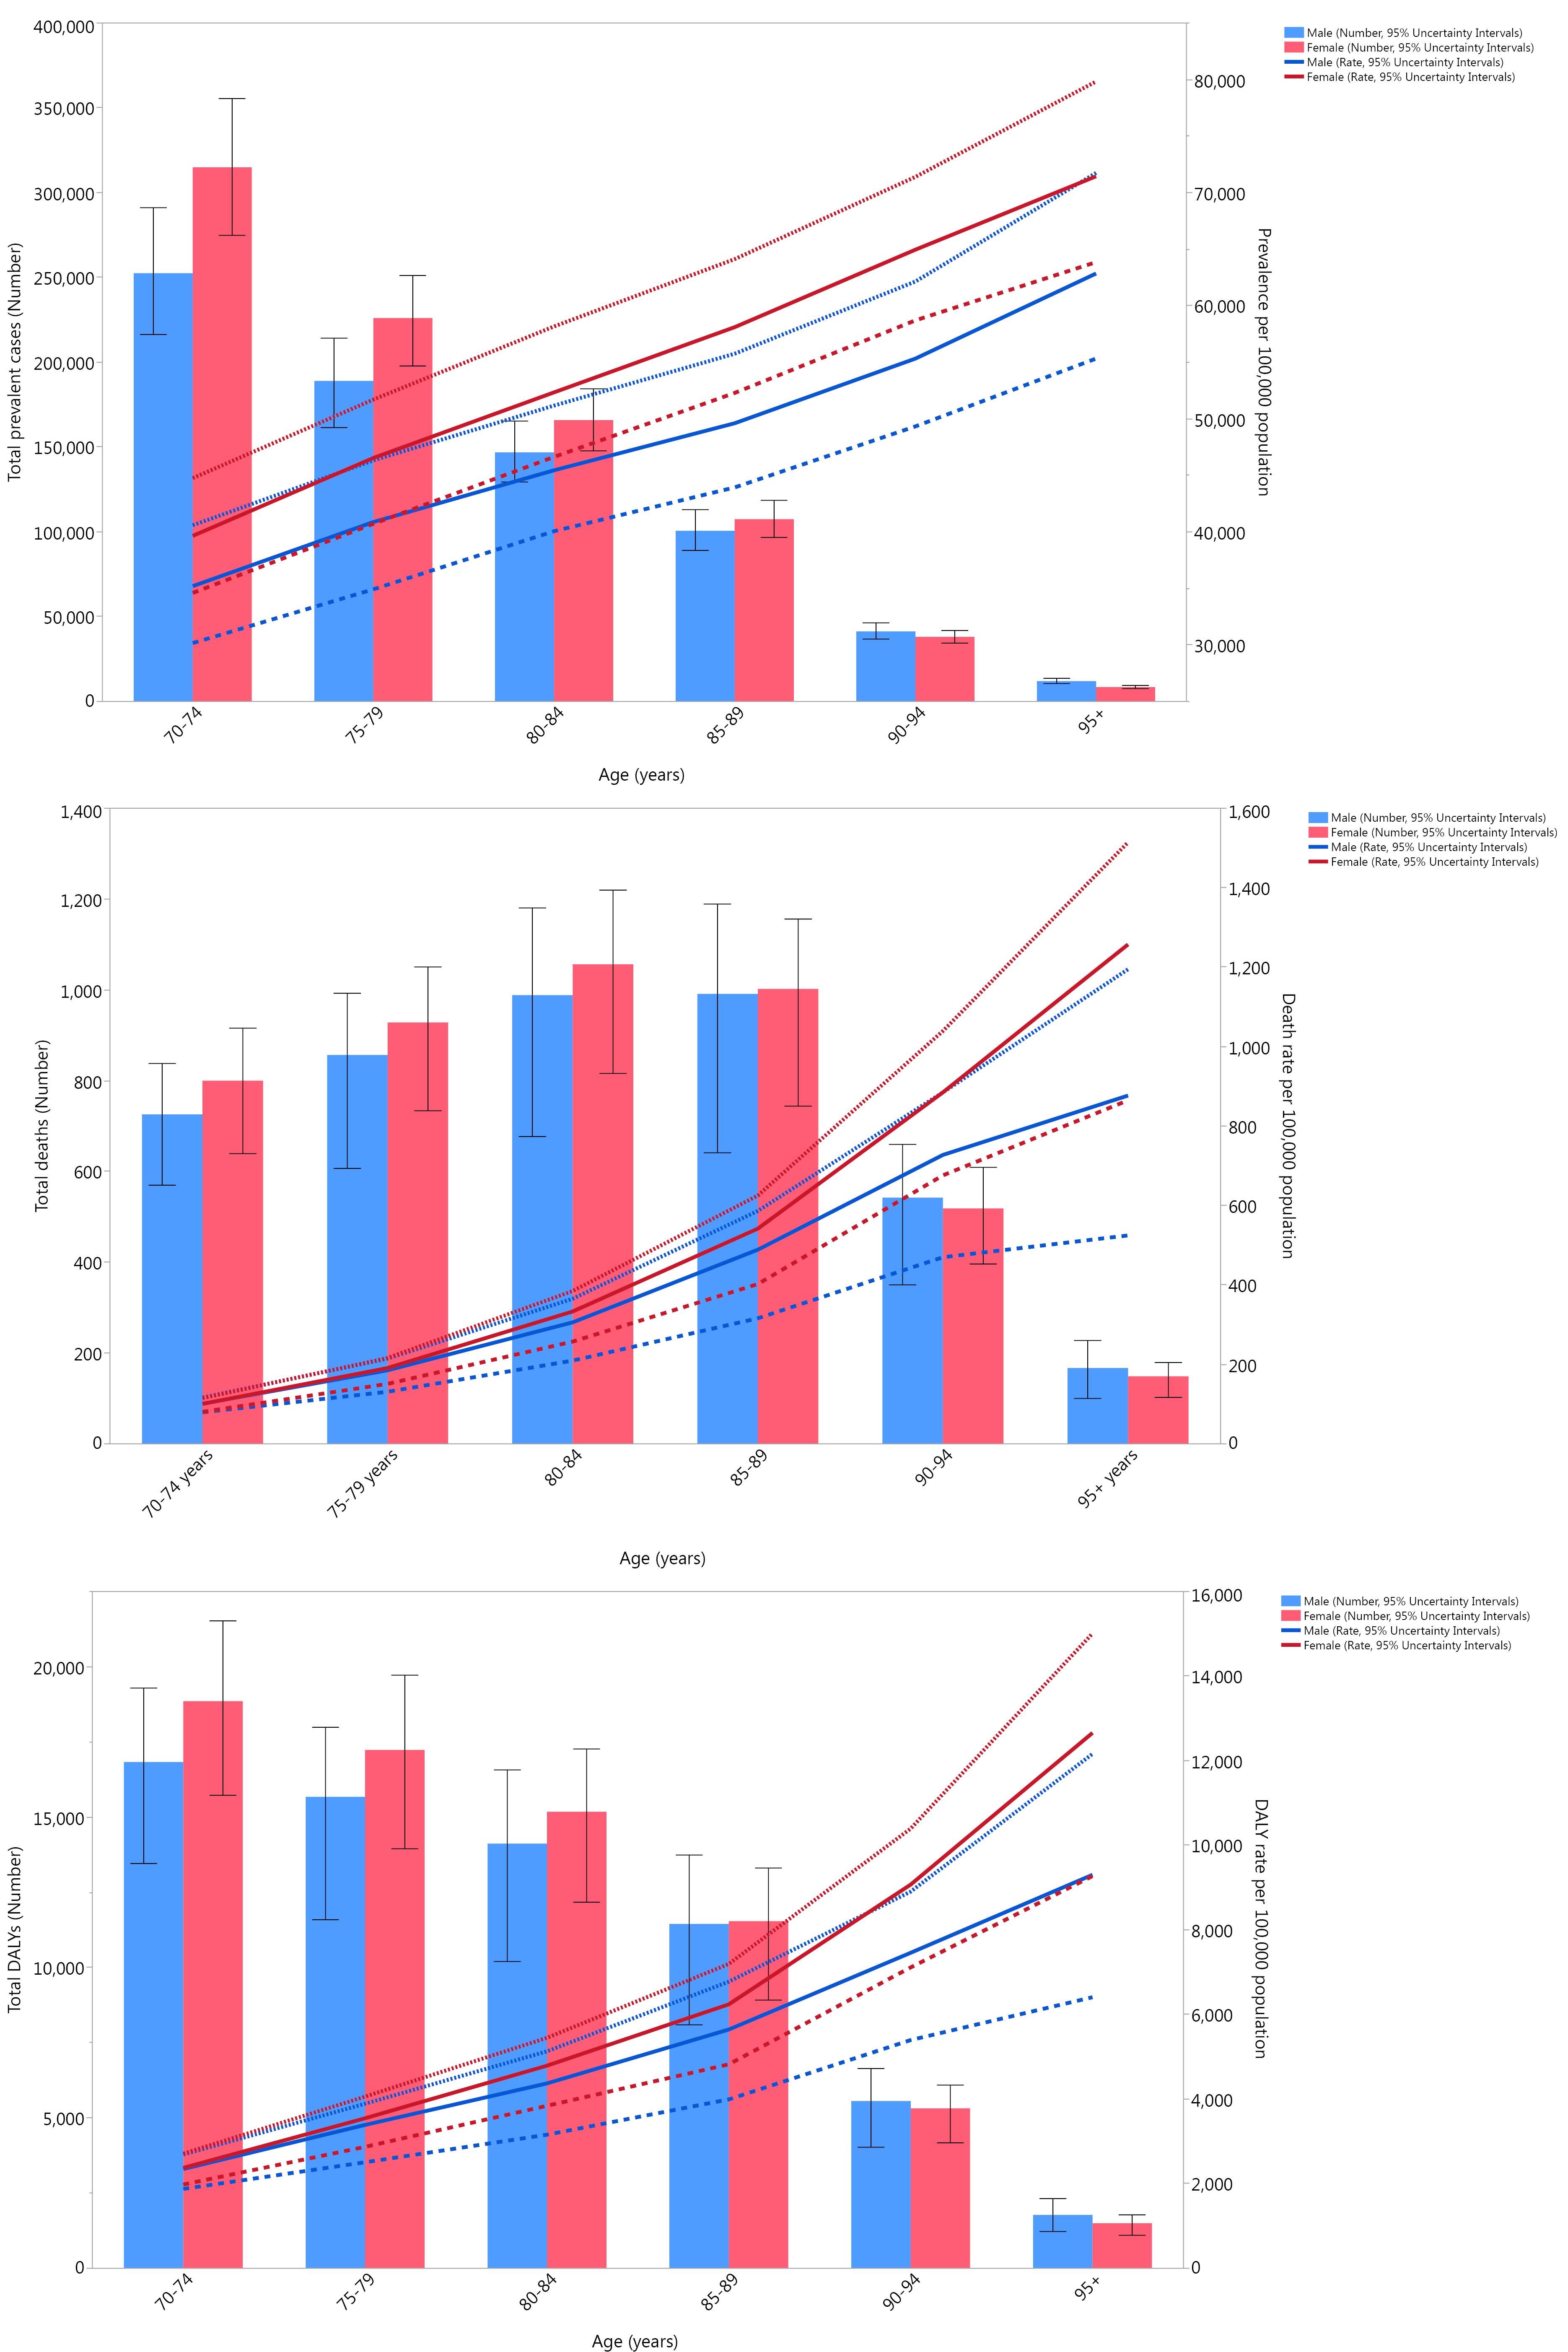
Figure 2.
(A) Number of Prevalent Cases and Prevalence, (B) Number of Deaths and Death Rate, and (C) Number of DALYs and DALY Rate for CKD (per 100 000 Population) in Iran in 2021 by Age and Sex. Note. UI: Uncertainty interval; DALY: Disability-adjusted life years; CKD: Chronic kidney disease. Dotted and dashed lines indicate 95% upper and lower UIs, respectively. Source. Generated from data available from http://ghdx.healthdata.org/gbd-results-tool.
.
(A) Number of Prevalent Cases and Prevalence, (B) Number of Deaths and Death Rate, and (C) Number of DALYs and DALY Rate for CKD (per 100 000 Population) in Iran in 2021 by Age and Sex. Note. UI: Uncertainty interval; DALY: Disability-adjusted life years; CKD: Chronic kidney disease. Dotted and dashed lines indicate 95% upper and lower UIs, respectively. Source. Generated from data available from http://ghdx.healthdata.org/gbd-results-tool.
The total deaths due to CKD in 2021 among the elderly population increased with age, peaked at the 80–84 age group, and then started to decrease with the advancement of age. In the 70–84 age group, women had higher death numbers, while in the older groups, men had more deaths. The ASR of deaths due to CKD per 100 000 in 2021 increased as the ages advanced and peaked at the 95 + age group; in all age groups, the female population had a higher rate of death compared to the male population. It should be noted that there were no statistically significant differences between sexes among all the age groups in terms of both death numbers and rates (Figure 2B). Additionally, at the provincial level, no significant differences were observed between the two sexes in terms of changes in death rates from 1990 to 2021 (Figure S5).
Similar to prevalence, DALYs due to CKD in 2021 peaked at the 70–74 age group in both sexes and decreased in older groups. DALYs were higher in the female population among the 70–89 age group, and in the population with more than 90 years of age, the male population had higher numbers; these differences were not statistically significant. Moreover, DALY rates per 100 000 population increased with the advancement of age, peaking at the 95 + age group, and while women had higher rates, this difference was not statistically significant (Figure 2C). In addition, similar to the prevalence and death rate, there were no significant differences in DALY rates due to CKD between sexes from 1990 to 2021 at the provincial level of Iran (Figure S6).
Comparison to the MENA Region
As illustrated in Figure 3, the DALY rates of Iran were lower in both men and women compared to those of the Middle East and North Africa (MENA) regions per 100 000 population. Women generally had closer DALY rates to those of the MENA region compared to men, and their 2021 ratios were higher than their 1990 ratios in the 80–84 and 90–94 age groups. On the other hand, men had the same ratio in most of the age groups in 1990 and 2021 and had a lower ratio in the 70–74 and 90–94 age groups in 2021 compared to 1990.
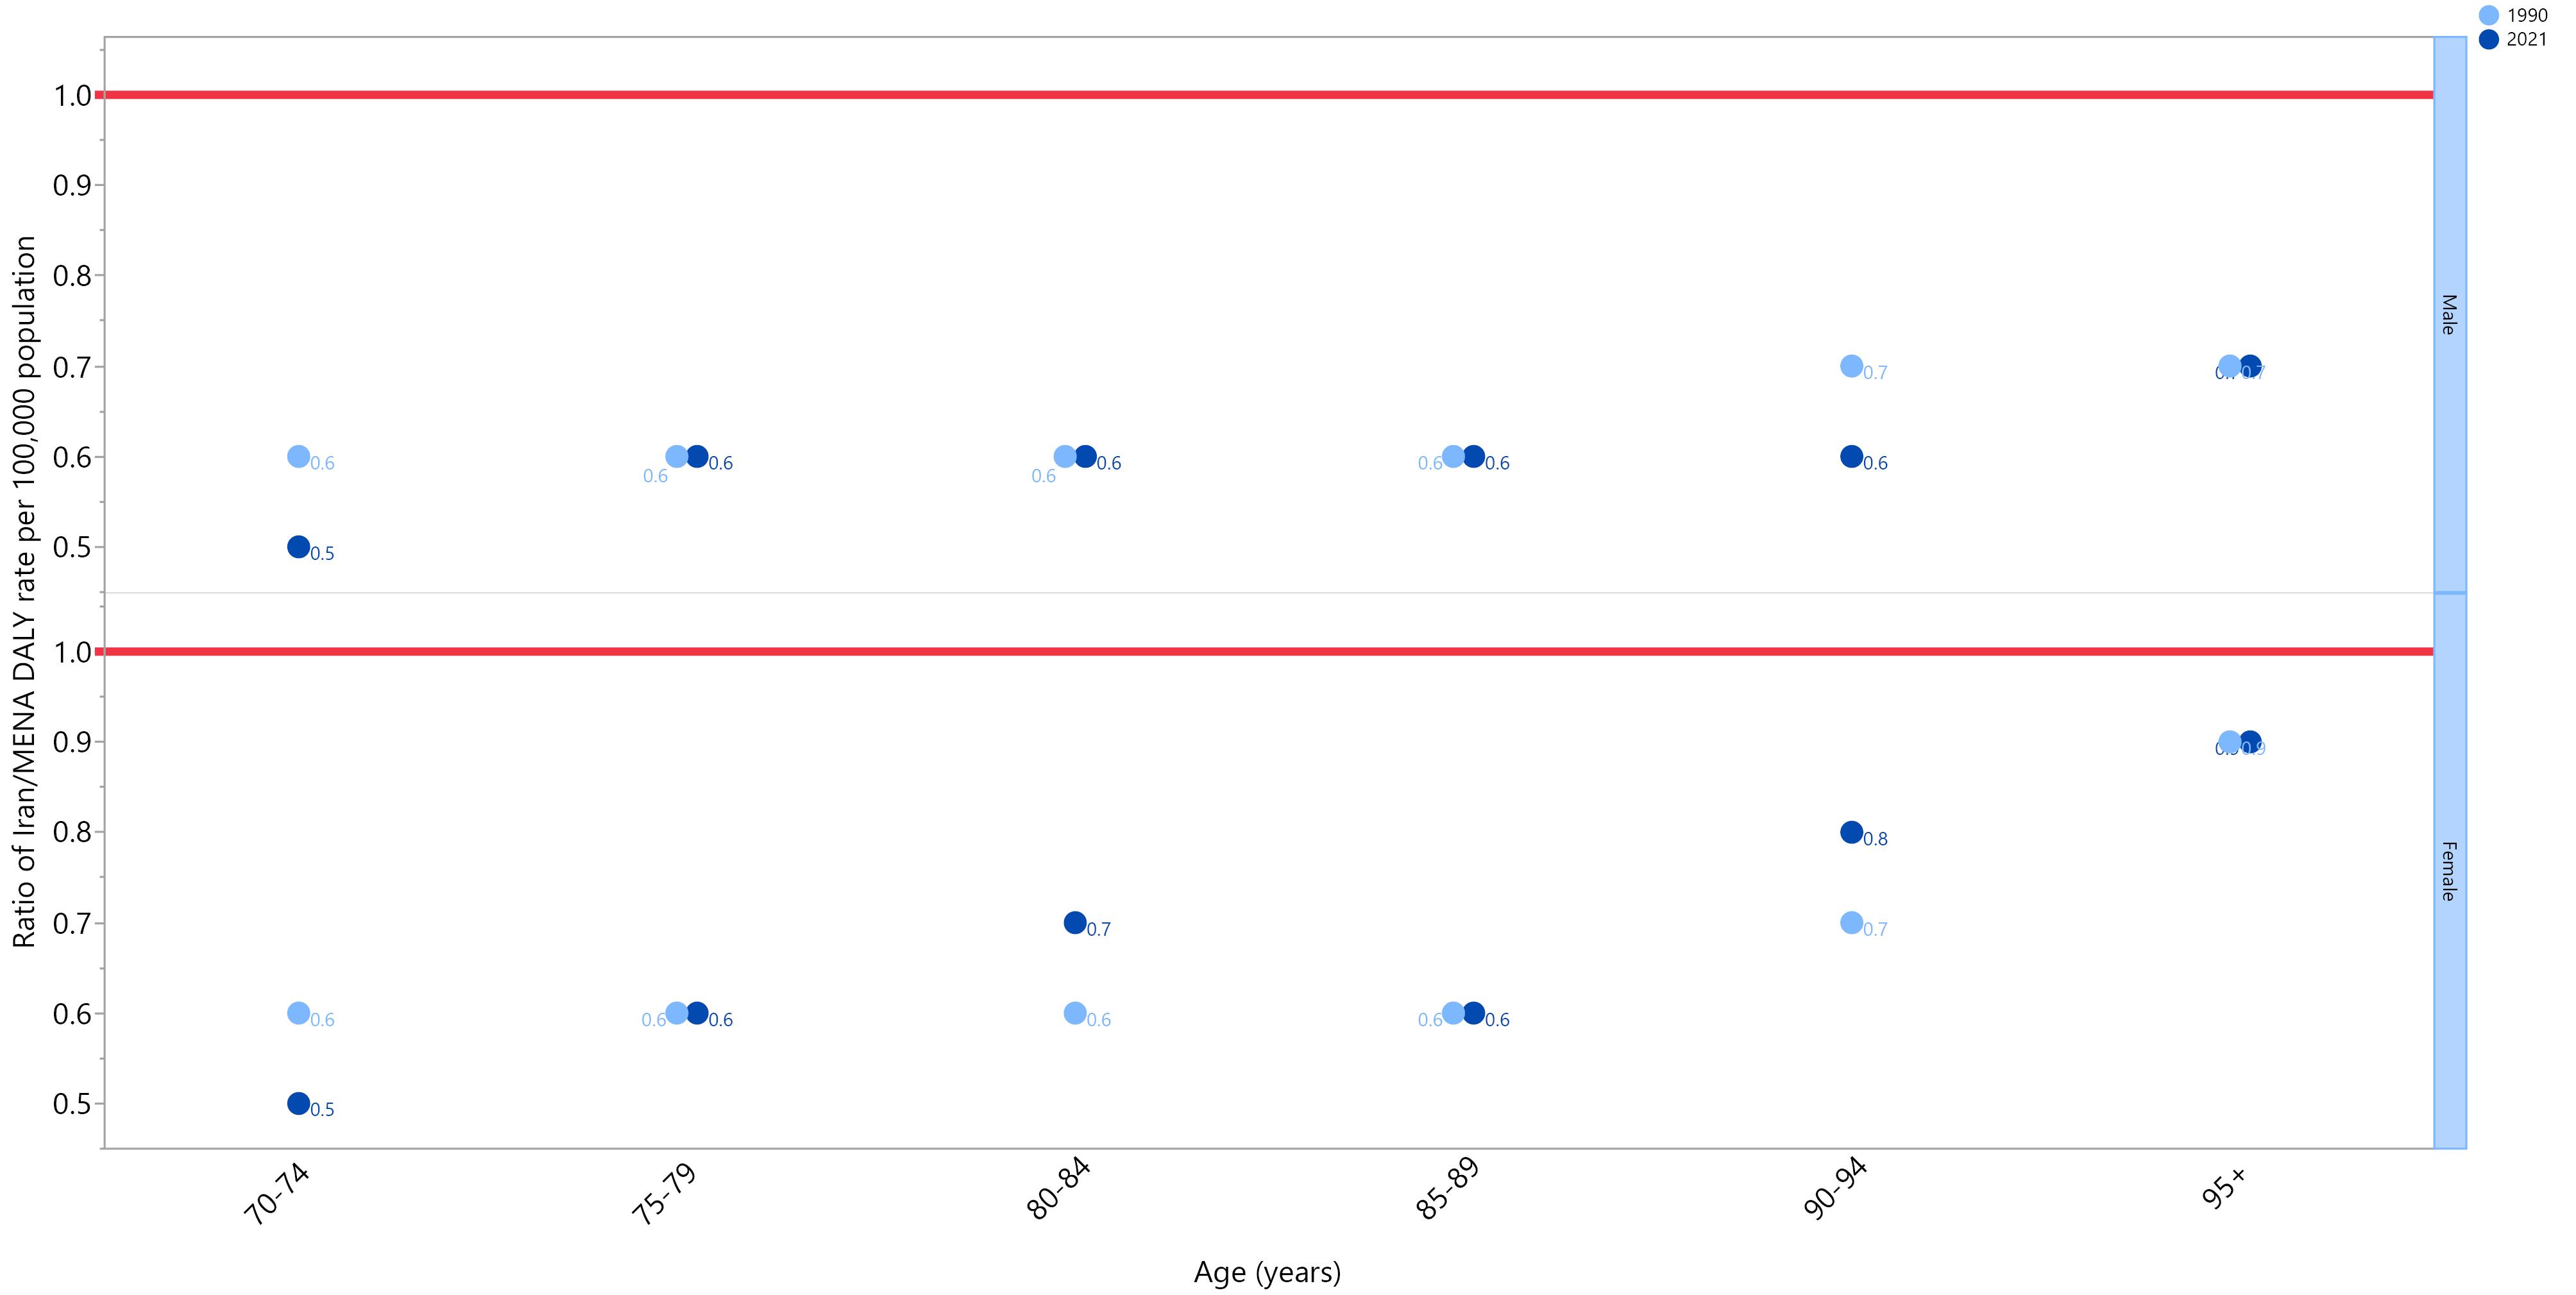
Figure 3.
Ratio of CKD’s DALY Rate of Iran’s Elderly ( ≥ 70 Years Old) to the Middle East and North Africa Region According to Age Group and Sex (1990–2021). Note. DALY: Disability-adjusted life years; CKD: Chronic kidney disease. Source. Generated from data available from http://ghdx.healthdata.org/gbd-results-tool.
.
Ratio of CKD’s DALY Rate of Iran’s Elderly ( ≥ 70 Years Old) to the Middle East and North Africa Region According to Age Group and Sex (1990–2021). Note. DALY: Disability-adjusted life years; CKD: Chronic kidney disease. Source. Generated from data available from http://ghdx.healthdata.org/gbd-results-tool.
Discussion
To the best of our knowledge, this is the first analysis of the GBD data to estimate the burden of CKD among Iranian individuals 70 years of age and older. The study’s findings indicated that from 1990 to 2021, the age-standardized prevalence rate of CKD in the senior population grew dramatically by 5% on a nationwide scale. The total burden of CKD in older Iranians appears to have steadily grown over the past three decades, according to changes in the DALY rate and age-standardized mortality rate.
The results of our study can be compared with several reports that have investigated the prevalence of CKD in an Iranian context. According to a GBD 2019 analysis of the general Iranian population, the ASR of death and DALY were reported to be 58.2 and 1127.2 per 100 000 population, respectively, all of which increased in our report.27 Moreover, most of CKD’s disease burden was focused on the elderly population in Iran, especially in the age groups of more than 80.27 CKD prevalence and the associated risk factors were also determined by Hosseinpanah et al using a representative sample of 10 063 people.28 According to their results, the age-standardized prevalence rate for CKD was 11.9%, and the overall prevalence was 18.9%. In the study by Tabrizi et al, a model of estimation was developed that showed the prevalence of different stages of CKD (GFR ≤ 90 mL and 60 mL per minute/1.73 m2 in CKDA and CKDB, respectively) was estimated to be 7.6–1.1%.29 Their approach demonstrated that in 2016, the prevalence for CKDA and CKDB may have increased to 25.7% and 3.7%, respectively, representing an increase of around 3.3 times for both values. Furthermore, according to a meta-analysis of nine studies, Bouya et al found that the prevalence of CKD in the Iranian population was 15.14% in 70 605 individuals, which was higher than the global average.30 Shahbazi et al conducted another investigation in this regard and reported that the number of CKD cases grew from 97 300 to 315 500 from 1990 to 2019.31 During this time span, the age-specific CKD incidence rate rose from 168.52 to 382.98 per 100 000. Therefore, the data from our investigation and the existing evidence both point to an increasing incidence of CKD in the Iranian population.
The aging phenomenon is one of the most important factors that is commonly linked to this finding. Due to advancements in healthcare and improved living standards, the length of life, population, and proportion of older individuals have been steadily increasing across the globe. According to the World Health Organization, the percentage of people over 60 in the globe will almost triple from 12% to 22% between 2015 and 2050, with 80% of this estimation residing in low- and middle-income nations.32 This shift in demographics has significant implications for the rise of non-communicable diseases (NCDs), also known as chronic diseases, including CKD. The underlying key factors that contribute to the link between an aging population and the increased prevalence of NCDs such as CKD can be categorized into two groups. Firstly, individuals become more susceptible to CKD due to the natural age-related decline in kidney function, even in the absence of other medical conditions.33 Secondly, there are several comorbidities and risk factors that are associated with aging, such as hypertension, diabetes, and cardiovascular disease, which can further exacerbate the risk of developing CKD.34-36
On the other hand, our provincial-level analysis revealed substantial geographical variations in the CKD burden in Iran. Provinces with the highest prevalent cases, mortality rates, and DALY rates were generally located in the central and eastern regions of Iran, such as Isfahan, Fars, Khorasan-e-Razavi, Tehran, and Sistan and Baluchistan. In contrast, provinces in the west, including Ilam, Kohgiluyeh and Boyer-Ahmad, and Chahar Mahaal and Bakhtiari, had relatively lower CKD burdens. This geographic variation in CKD burden within Iran is an important finding that likely reflects differences in various risk factors and social determinants of health across the regions. However, it is important to note that the data available to support these identified patterns are currently limited. Although Iran has been a forerunner in renal transplantation rates in the past years, it has fallen behind some of its neighboring countries in recent years.19,37 This decrease in the transplantation per million ratios can be related to the growing population of Iran and its increasing need for such treatments. Furthermore, renal transplantation and renal replacement therapies are only available in a few centers of large cities, limiting access to optimal treatment for most of the remote cities and regions, thus leading to higher mortality rates and DALYs.
It is worth noting that in a resource-limited context, such as the challenging circumstances existing in middle-to-low-income countries, including Iran, older individuals may experience restricted access to proper healthcare services.38 Hence, early detection and management of CKD and other NCDs become suboptimal, allowing the disease to progress and contribute to the rising prevalence of CKD in aging populations.39 There is also a socioeconomic factor contributing to the rising prevalence of CKD, as older adults from lower socioeconomic backgrounds face limited access to education, compromising diets, and the lack of proper physical activity, all of which can influence the development and progression of NCDs.40-42
The observed increases in CKD burden over time and the substantial geographic variations highlight the need for targeted public health interventions and resource allocation to address this growing challenge. Currently, there are successful CKD management programs from other countries that could be potentially adapted for the Iranian context; for instance, the Kidney Disease Outcomes Quality Initiative guidelines, developed by the National Kidney Foundation, provide evidence-based recommendations for the diagnosis and management of CKD in the United States healthcare system.43,44 Another example is the Australian KidneyCheck program, which is a comprehensive, community-based screening and early intervention initiative that aims to identify individuals with CKD or at high risk of developing it using a mobile screening van and collaborates with primary care providers.45 By carefully analyzing the key features, implementation strategies, and outcomes of these programs, Iranian policymakers and healthcare providers could identify effective approaches that can be tailored to the local context.
Strengths and Limitations
To the best of our knowledge, this is the first study that has evaluated the burden of CKD at the provincial level in the elderly population of Iran with an in-depth analysis of its prevalence, deaths, and DALYs from 1990 to 2021. It should be pointed out that the current study is limited by the reliance on modeled estimates rather than primary data collection and the inability to assess the impact of specific risk factors or comorbidities on CKD outcomes. Moreover, different definitions have been used in reporting CKD across the nation, which can lead to an underestimation of the true burden of this disease. Further, factors such as changes in healthcare access, quality of care, and risk factor management over time may not be fully reflected in the GBD data, potentially leading to an incomplete understanding of the drivers of the CKD burden. These limitations should be kept in mind while interpreting the findings of the current study.
Conclusions
CKD remains a health-system concern across the Iranian elderly population, and its burden has increased in the past 30 years. Similar to the aging populations worldwide and with the growing prevalence of its attributed risk factors such as diabetes, hypertension, and obesity, it is expected that this burden will further increase in the future. The implementation of preemptive measures, screening tests, and risk-factor control policies from an early age can limit this concerning rise in CKD’s prevalence and deaths. Further, raising public awareness of the dangers of this disease and its prevention methods can help reduce its burden on a broader scale. Furthermore, providing effective treatment infrastructures such as renal replacement therapy facilities, CKD-specific medications, and kidney transplantation can enhance the quality of life of the patients living with this disease.
Acknowledgments
We would like to thank the Institute for Health Metrics and Evaluation staff and its collaborators who prepared these publicly available data. This study is based on publicly available data and solely reflects the opinions of its authors rather than those of the Institute for Health Metrics and Evaluation.
Author contributions
Conceptualization: Ali-Asghar Kolahi.
Formal analysis: Ali-Asghar Kolahi.
Methodology: Ali-Asghar Kolahi.
Supervision: Ali-Asghar Kolahi.
Visualization: Ali-Asghar Kolahi.
Writing–original draft: Asra Fazlollahi, Fatemeh Tahmasbi, Seyed Ehsan Mousavi, Mark JM Sullman, Ali-Asghar Kolahi.
Writing–review & editing: Asra Fazlollahi, Fatemeh Tahmasbi, Seyed Ehsan Mousavi, Mark JM Sullman, Ali-Asghar Kolahi.
Data availability statement
The data used for these analyses are all publicly available at http://ghdx.healthdata.org/gbd-results-tool.
Ethical approval
The present study was reviewed and approved by the Ethics Committee of Shahid Beheshti University of Medical Sciences, Tehran, Iran (Ethical code: IR.SBMU.RETECH.REC.1402.043).
Consent for publication
Not applicable.
Conflict of interests
None declared.
Supplementary files
Supplementary file 1 contains Tables S1-S4 and Figures S1-S6.
(pdf)
References
- Eknoyan G, Lameire N, Eckardt K, Kasiske B, Wheeler D, Levin A. KDIGO 2012 clinical practice guideline for the evaluation and management of chronic kidney disease. Kidney Int 2013; 3(1):5-14. [ Google Scholar]
- Ren J, Dai C. Pathophysiology of chronic kidney disease. In: Yang J, He W, eds. Chronic Kidney Disease: Diagnosis and Treatment. Singapore: Springer; 2020. p. 13-32. 10.1007/978-981-32-9131-7_2.
- Bikbov B, Purcell CA, Levey AS, Smith M, Abdoli A, Abebe M. Global, regional, and national burden of chronic kidney disease, 1990-2017: a systematic analysis for the Global Burden of Disease Study 2017. Lancet 2020; 395(10225):709-33. doi: 10.1016/s0140-6736(20)30045-3 [Crossref] [ Google Scholar]
- Zhang S, Ren HF, Du RX, Sun WL, Fu ML, Zhang XC. Global, regional, and national burden of kidney dysfunction from 1990 to 2019: a systematic analysis from the Global Burden of Disease Study 2019. BMC Public Health 2023; 23(1):1218. doi: 10.1186/s12889-023-16130-8 [Crossref] [ Google Scholar]
- Tabatabaei-Malazy O, Saeedi Moghaddam S, Khashayar P, Keykhaei M, Sharifnejad Tehrani Y, Malekpour MR. Regional burden of chronic kidney disease in North Africa and Middle East during 1990- 2019; Results from Global Burden of Disease Study 2019. Front Public Health 2022; 10:1015902. doi: 10.3389/fpubh.2022.1015902 [Crossref] [ Google Scholar]
- Kovesdy CP. Epidemiology of chronic kidney disease: an update 2022. Kidney Int Suppl (2011) 2022; 12(1):7-11. doi: 10.1016/j.kisu.2021.11.003 [Crossref] [ Google Scholar]
- Di Lullo L, House A, Gorini A, Santoboni A, Russo D, Ronco C. Chronic kidney disease and cardiovascular complications. Heart Fail Rev 2015; 20(3):259-72. doi: 10.1007/s10741-014-9460-9 [Crossref] [ Google Scholar]
- Dhondup T, Qian Q. Electrolyte and acid-base disorders in chronic kidney disease and end-stage kidney failure. Blood Purif 2017; 43(1-3):179-88. doi: 10.1159/000452725 [Crossref] [ Google Scholar]
- Cannata-Andía JB, Martín-Carro B, Martín-Vírgala J, Rodríguez-Carrio J, Bande-Fernández JJ, Alonso-Montes C. Chronic kidney disease-mineral and bone disorders: pathogenesis and management. Calcif Tissue Int 2021; 108(4):410-22. doi: 10.1007/s00223-020-00777-1 [Crossref] [ Google Scholar]
- Atkinson MA, Warady BA. Anemia in chronic kidney disease. Pediatr Nephrol 2018; 33(2):227-38. doi: 10.1007/s00467-017-3663-y [Crossref] [ Google Scholar]
- Syed-Ahmed M, Narayanan M. Immune dysfunction and risk of infection in chronic kidney disease. Adv Chronic Kidney Dis 2019; 26(1):8-15. doi: 10.1053/j.ackd.2019.01.004 [Crossref] [ Google Scholar]
- Krishnan A, Teixeira-Pinto A, Lim WH, Howard K, Chapman JR, Castells A. Health-related quality of life in people across the spectrum of CKD. Kidney Int Rep 2020; 5(12):2264-74. doi: 10.1016/j.ekir.2020.09.028 [Crossref] [ Google Scholar]
- Iida H, Fujimoto S, Wakita T, Yanagi M, Suzuki T, Koitabashi K, et al. Psychological flexibility and depression in advanced CKD and dialysis. Kidney Med 2020;2(6):684-91.e1. 10.1016/j.xkme.2020.07.004.
- Fletcher BR, Damery S, Aiyegbusi OL, Anderson N, Calvert M, Cockwell P. Symptom burden and health-related quality of life in chronic kidney disease: a global systematic review and meta-analysis. PLoS Med 2022; 19(4):e1003954. doi: 10.1371/journal.pmed.1003954 [Crossref] [ Google Scholar]
- Jha V, Al-Ghamdi SMG, Li G, Wu MS, Stafylas P, Retat L. Global Economic Burden Associated with chronic kidney disease: a pragmatic review of medical costs for the Inside CKD Research Programme. Adv Ther 2023; 40(10):4405-20. doi: 10.1007/s12325-023-02608-9 [Crossref] [ Google Scholar]
- Betts KA, Song J, Faust E, Yang K, Du Y, Kong SX. Medical costs for managing chronic kidney disease and related complications in patients with chronic kidney disease and type 2 diabetes. Am J Manag Care 2021; 27(20 Suppl):S369-74. doi: 10.37765/ajmc.2021.88807 [Crossref] [ Google Scholar]
- Aoun M, Helou E, Sleilaty G, Zeenny RM, Chelala D. Cost of illness of chronic kidney disease in Lebanon: from the societal and third-party payer perspectives. BMC Health Serv Res 2022; 22(1):586. doi: 10.1186/s12913-022-07936-0 [Crossref] [ Google Scholar]
- Ulasi II, Awobusuyi O, Nayak S, Ramachandran R, Musso CG, Depine SA. Chronic kidney disease burden in low-resource settings: regional perspectives. Semin Nephrol 2022; 42(5):151336. doi: 10.1016/j.semnephrol.2023.151336 [Crossref] [ Google Scholar]
- Amouzegar A, Abu-Alfa AK, Alrukhaimi MN, Bello AK, Ghnaimat MA, Johnson DW. International Society of Nephrology Global Kidney Health Atlas: structures, organization, and services for the management of kidney failure in the Middle East. Kidney Int Suppl (2011) 2021; 11(2):e47-56. doi: 10.1016/j.kisu.2021.01.002 [Crossref] [ Google Scholar]
- Moradpour A, Hadian M, Tavakkoli M. Economic evaluation of end stage renal disease treatments in Iran. Clin Epidemiol Glob Health 2020; 8(1):199-204. doi: 10.1016/j.cegh.2019.07.001 [Crossref] [ Google Scholar]
- Abraham G, Varughese S, Thandavan T, Iyengar A, Fernando E, Naqvi SA. Chronic kidney disease hotspots in developing countries in South Asia. Clin Kidney J 2016; 9(1):135-41. doi: 10.1093/ckj/sfv109 [Crossref] [ Google Scholar]
- Swanepoel CR, McCulloch MI, Abraham G, Donner JA, Alrukhaimi MN, Blake PG. Challenges for sustainable end-stage kidney disease care in low-middle-income countries: the problem of the workforce. Kidney Int Suppl (2011) 2020; 10(1):e49-54. doi: 10.1016/j.kisu.2019.11.007 [Crossref] [ Google Scholar]
- Ke C, Liang J, Liu M, Liu S, Wang C. Burden of chronic kidney disease and its risk-attributable burden in 137 low-and middle-income countries, 1990-2019: results from the Global Burden of Disease Study 2019. BMC Nephrol 2022; 23(1):17. doi: 10.1186/s12882-021-02597-3 [Crossref] [ Google Scholar]
- Noroozian M. The elderly population in Iran: an ever-growing concern in the health system. Iran J Psychiatry Behav Sci 2012; 6(2):1-6. [ Google Scholar]
- Moazzeni SS, Hizomi Arani R, Hasheminia M, Tohidi M, Azizi F, Hadaegh F. High incidence of chronic kidney disease among Iranian diabetic adults: using CKD-EPI and MDRD equations for estimated glomerular filtration rate. Diabetes Metab J 2021; 45(5):684-97. doi: 10.4093/dmj.2020.0109 [Crossref] [ Google Scholar]
- Ferrari AJ, Santomauro DF, Aali A, Abate YH, Abbafati C, Abbastabar H. Global incidence, prevalence, years lived with disability (YLDs), disability-adjusted life-years (DALYs), and healthy life expectancy (HALE) for 371 diseases and injuries in 204 countries and territories and 811 subnational locations, 1990-2021: a systematic analysis for the Global Burden of Disease Study 2021. Lancet 2024; 403(10440):2133-61. doi: 10.1016/s0140-6736(24)00757-8 [Crossref] [ Google Scholar]
- Nejadghaderi SA, Saeedi Moghaddam S, Keykhaei M, Shobeiri P, Rezaei N, Rezaei N. Trends of national and sub-national burden attributed to kidney dysfunction risk factor in Iran: 1990-2019. Front Endocrinol (Lausanne) 2023; 14:1115833. doi: 10.3389/fendo.2023.1115833 [Crossref] [ Google Scholar]
- Hosseinpanah F, Kasraei F, Nassiri AA, Azizi F. High prevalence of chronic kidney disease in Iran: a large population-based study. BMC Public Health 2009; 9:44. doi: 10.1186/1471-2458-9-44 [Crossref] [ Google Scholar]
- Tabrizi R, Zolala F, Nasirian M, Baneshi MR, Etminan A, Sekhavati E. Estimation of the prevalence of chronic kidney disease: the results of a model-based estimation in Kerman, Iran. Med J Islam Repub Iran 2016; 30:338. [ Google Scholar]
- Bouya S, Balouchi A, Rafiemanesh H, Hesaraki M. Prevalence of chronic kidney disease in Iranian general population: a meta-analysis and systematic review. Ther Apher Dial 2018; 22(6):594-9. doi: 10.1111/1744-9987.12716 [Crossref] [ Google Scholar]
- Shahbazi F, Doosti-Irani A, Soltanian A, Poorolajal J. National trends and projection of chronic kidney disease incidence according to etiology from 1990 to 2030 in Iran: a Bayesian age-period-cohort modeling study. Epidemiol Health 2023; 45:e2023027. doi: 10.4178/epih.e2023027 [Crossref] [ Google Scholar]
- World Health Organization (WHO). Ageing and Health. WHO; October 1, 2024.
- Alfano G, Perrone R, Fontana F, Ligabue G, Giovanella S, Ferrari A. Rethinking chronic kidney disease in the aging population. Life (Basel) 2022; 12(11):1724. doi: 10.3390/life12111724 [Crossref] [ Google Scholar]
- Mallamaci F, Tripepi G. Risk factors of chronic kidney disease progression: between old and new concepts. J Clin Med 2024; 13(3):678. doi: 10.3390/jcm13030678 [Crossref] [ Google Scholar]
- Jankowski J, Floege J, Fliser D, Böhm M, Marx N. Cardiovascular disease in chronic kidney disease: pathophysiological insights and therapeutic options. Circulation 2021; 143(11):1157-72. doi: 10.1161/circulationaha.120.050686 [Crossref] [ Google Scholar]
- Burnier M, Damianaki A. Hypertension as cardiovascular risk factor in chronic kidney disease. Circ Res 2023; 132(8):1050-63. doi: 10.1161/circresaha.122.321762 [Crossref] [ Google Scholar]
- Karam S, Amouzegar A, Alshamsi IR, Al Ghamdi SM, Anwar S, Ghnaimat M. Capacity for the management of kidney failure in the International Society of Nephrology Middle East region: report from the 2023 ISN Global Kidney Health Atlas (ISN-GKHA). Kidney Int Suppl (2011) 2024; 13(1):57-70. doi: 10.1016/j.kisu.2024.01.009 [Crossref] [ Google Scholar]
- Mohd Rosnu NS, Singh DKA, Mat Ludin AF, Ishak WS, Abd Rahman MH, Shahar S. Enablers and barriers of accessing health care services among older adults in South-East Asia: a scoping review. Int J Environ Res Public Health 2022; 19(12):7351. doi: 10.3390/ijerph19127351 [Crossref] [ Google Scholar]
- van Zyl C, Badenhorst M, Hanekom S, Heine M. Unravelling ‘low-resource settings’: a systematic scoping review with qualitative content analysis. BMJ Glob Health 2021; 6(6):e005190. doi: 10.1136/bmjgh-2021-005190 [Crossref] [ Google Scholar]
- Devereux-Fitzgerald A, Powell R, French DP. The acceptability of physical activity to older adults living in lower socioeconomic status areas: a multi-perspective study. Int J Environ Res Public Health 2021; 18(22):11784. doi: 10.3390/ijerph182211784 [Crossref] [ Google Scholar]
- Rawal LB, Smith BJ, Quach H, Renzaho AM. Physical activity among adults with low socioeconomic status living in industrialized countries: a meta-ethnographic approach to understanding socioecological complexities. J Environ Public Health 2020; 2020:4283027. doi: 10.1155/2020/4283027 [Crossref] [ Google Scholar]
- Safiri S, Motlagh Asghari K, Sullman MJM. The global burden of diseases and injuries among older adults. Int J Aging 2023; 1:e16. doi: 10.34172/ija.2023.e16 [Crossref] [ Google Scholar]
- Inker LA, Astor BC, Fox CH, Isakova T, Lash JP, Peralta CA. KDOQI US commentary on the 2012 KDIGO clinical practice guideline for the evaluation and management of CKD. Am J Kidney Dis 2014; 63(5):713-35. doi: 10.1053/j.ajkd.2014.01.416 [Crossref] [ Google Scholar]
- National Kidney Foundation. KDOQI clinical practice guideline for diabetes and CKD: 2012 update. Am J Kidney Dis 2012; 60(5):850-86. doi: 10.1053/j.ajkd.2012.07.005 [Crossref] [ Google Scholar]
- Chen N, Hsu CC, Yamagata K, Langham R. Challenging chronic kidney disease: experience from chronic kidney disease prevention programs in Shanghai, Japan, Taiwan and Australia. Nephrology (Carlton) 2010; 15 Suppl 2:31-6. doi: 10.1111/j.1440-1797.2010.01309.x [Crossref] [ Google Scholar]