Int J Aging.2023;1 :e5.
doi: 10.34172/ija.2023.e5
Original Article
The Burden of Cancers and Their Attributable Risk Factors Among Iranian Adults Aged 70 and Above, 1990-2019
Maryam Noori 1  , Seyed Ehsan Mousavi 2, Kimia Motlagh Asghari 3, Seyed Aria Nejadghaderi 4, 5, Mark J M Sullman 6, 7, Ali-Asghar Kolahi 8, *
Author information:
1Student Research Committee, School of Medicine, Iran University of Medical Sciences, Tehran, Iran
2Hematology and Oncology Research Center, Tabriz University of Medical Sciences, Tabriz, Iran
3Research Center for Integrative Medicine in Aging, Aging Research Institute, Tabriz University of Medical Sciences, Tabriz, Iran
4School of Medicine, Shahid Beheshti University of Medical Sciences, Tehran, Iran
5Systematic Review and Meta-Analysis Expert Group (SRMEG), Universal Scientific Education and Research Network (USERN), Tehran, Iran
6Department of Life and Health Sciences, University of Nicosia, Nicosia, Cyprus
7Department of Social Sciences, University of Nicosia, Nicosia, Cyprus
8Social Determinants of Health Research Center, Shahid Beheshti University of Medical Sciences, Tehran, Iran
Abstract
Objectives:
To report the burden of cancers and their attributable risk factors among Iranian adults aged 70 and older by age, sex and type of cancer from 1990 to 2019.
Design:
Systematic analysis.
Outcome measures:
Data on the incidence, death, and disability-adjusted life years (DALYs) due to cancers were obtained from the Global Burden of Disease (GBD) study 2019 for Iranian adults aged 70 and older from 1990 to 2019. The counts and age-standardized rates (per 100000) were reported, as well as 95% uncertainty intervals.
Results:
In 2019, cancers had an age-standardized incidence rate of 10985.6 per 100000for adults aged 70 and above in Iran and an age-standardized death rate of 853.2, which was 13.8% higher than in 1990. In 2019, the age-standardized DALY rate was 11892.5, which had not changed significantly since 1990. The age-standardized DALY rates of cancers, among Iranian adults aged 70 and older, were the highest and lowest in Ardebil (17246.2) and Hormozgan (7723.1), respectively. The age-standardized DALY rates peaked in the 75-79 age group and then reduced with advancing age. The rates for males were higher than for females. Nationally, high tobacco consumption (18.0%), high body mass index (BMI) (5.1%), high fasting plasma glucose (5.0%), and dietary risks (5.0%) had the four highest attributable DALYs for cancers in 2019. Finally, stomach cancer, tracheal, bronchus and lung cancer, and colon and rectum cancer had the highest DALY rates among the elderly Iranian population in 2019.
Conclusions:
Despite the steady incidence rate of cancers, the mortality rate among elderly Iranians has risen over the last three decades. The implementation of cancer prevention measures, in particular screening programs, would help alleviate the future increase in the burden of cancer among the elderly in Iran.
Keywords: Neoplasms, Global Burden of Disease, Risk factor, Geriatrics, Iran
Introduction
As a developing country, Iran is facing a major demographic and epidemiological transition. One aspect of this transition involves changes in the disease burden mainly based on communicable to non-communicable diseases. Cancers are one of these non-communicable diseases that impose a substantial burden on the health system.1 The emergence of the National Cancer Registry has provided vital information about the burden imposed by different cancers and diseases in Iran.2,3
The prevalence of cancers is rapidly increasing in most countries, but developing countries are facing an even faster increase.4 The burden of cancers poses significant challenges in its prevention and control.5 In 2019, there were about 23.6 million new cases of cancer worldwide, ten million deaths, and around 250 million cancer-related disability-adjusted life years (DALYs).5 Among the 22 groups of diseases and injuries monitored in the Global Burden of Disease (GBD) 2019 study, globally, cancer was the second most common cause of death and DALYs in 2019. In a ddition, the largest proportion of deaths was found in the middle quintile and high-middle quantile countries according to the sociodemographic index.5
Currently, cancers are the third leading cause of mortality in Iran.6 Although Iran’s health care system has been reasonably successful in controlling mortality, the burden of complications and the need for rehabilitation remain challenging.7 About 36 500 people died of cancer in Iran in 2015, with an age-standardized death rate of 45.4 (per 100 000), and the rate was higher among males than females (55.0 vs. 35.8).8 The largest number of deaths was found in 2001, which was followed by decreases over the following years.8
The incidence and mortality of most cancers increase with age.9 Due to the rapidly aging population in Iran, it is expected that the burden of cancers will also rise in the near future. Although several previous studies have reported the epidemiology of malignancies in Iran,10-13 little is known about the burden of cancer among older citizens. Therefore, this research investigated the national and provincial burden of cancers and their risk factors among individuals aged 70 and older in Iran in terms of sex, age, and cancer type from 1990 to 2019.
Methods
Overview
GBD 2019 has estimated the burden of 369 diseases and injuries, along with 87 risk factors, in more than 200 countries and territories since 1990.4,14 The burden of all cancer groups, as one of the major health problems, among the elderly population of Iran has yet to be reported. Hence, this research reported the burden of cancers among Iranians aged 70 and above from 1990 to 2019. A summary of the methodology is provided below. However, for a comprehensive description of the procedures used in the GBD project to estimate the burden, please see the GBD capstone articles.4,14 The raw data were obtained from https://vizhub.healthdata.org/gbd-compare/ and http://ghdx.healthdata.org/gbd-results-tool websites.
Case Definition
In GBD 2019, the incidence, prevalence, and disability were calculated for all cancers and benign neoplasms, which were defined using the International Classification of Diseases (10th revision) codes C00-D49. As in the previous iterations of the GBD projects, the prevalence of all cancers was modeled up to ten years after the incidence. The prevalence of five surgery-related permanent sequelae (i.e., cystectomy, laryngectomy, mastectomy, prostatectomy, and stoma) was also estimated over the 10-year period
To estimate the level of disability for each type of cancer, the overall prevalence was divided into four sequelae, including diagnosis and primary therapy, controlled, metastatic, and terminal phases. The diagnosis and primary therapy phase ranged from the symptom onset until the end of the treatment. The controlled phase began at the end of the primary treatment and finished after the occurrence of one of the outcomes, including cure-recurrence and progression-free survival after a decade, death from a different cause, or advancement to the metastatic stage. The metastatic stage involved intensive treatment for metastatic disease that was ascertained for each cancer type using averages from the Surveillance, Epidemiology, and End Results Program. Finally, the terminal phase was the last month before death. These four sequelae all have individual disability weights, but they are the same for all types of cancer types. As the treatment for five different cancers resulted in long-term disability, additional levels of disability were estimated for the following cancers: breast, bladder, colon and rectum, larynx, and prostate (Table S1).4
Modeling Strategy
The cause of death database included mortality data from vital registration, verbal autopsy, and cancer registry. The mortality-to-incidence ratios (MIRs) were calculated by matching the incidence and mortality data from cancer registries by sex, age, type of cancer, year, and location. The MIRs were then employed to fit cause-specific fixed effects logistic regressions with covariates for sex, age category, and the healthcare-access and quality index. The final MIR estimates were pooled with the final mortality estimates (both after 1000 iterations) to produce 1000 incidence estimates, which were then used to produce the estimated mean incidence and its corresponding 95% uncertainty interval (UIs).4
Following the transformation of cancer mortality estimates into incidence estimates, the incidence estimates were merged with the yearly relative survival estimates from 1 to 10 years. The survival estimation approach was first performed in GBD 2017 in order to more directly use MIRs to produce yearly cancer survival estimates. In GBD 2019, these methods were updated to include age-specific survival curves rather than all-age survival curves. To convert relative survival into absolute survival (taking into account background mortality), the GBD 2019 lifetables were utilized, along with an exponential survival function. Next, absolute survival was merged with the incidence estimates in order to model the prevalence in each year following diagnosis, which was then divided into the four different sequelae.4
Those who survived more than a decade were deemed to be cured when calculating disability due to cancer. In the survivor group, population prevalence was split into the following two sequelae: diagnosis and primary therapy and the controlled phase. For those who did not live over 10 years, the yearly prevalence was split into the four sequelae using the fixed time periods for each of the four phases (i.e., diagnosis, primary therapy, metastatic, and terminal), while the remaining prevalence was allocated to the controlled phase.4
The total number of patients experiencing the sequelae-specific procedures (i.e., cystectomy, laryngectomy, mastectomy, prostatectomy, and stoma) was modeled using data sourced from hospitals. To model procedure-related disability for each of the five cancers, the proportions of each cancer population undergoing these procedures were obtained from hospital data and entered into a DisMod-MR 2.1 model to model the proportions by location, age, sex and year. To model the proportion of the cancer population that went into remission in the 10 years following diagnosis (with and without procedure-related disability), the proportion of the population in the remission phase was multiplied by the percentage undergoing a procedure. Finally, the number of years lived with disabilities (YLDs) was modeled by multiplying the procedure sequelae prevalence and the general sequelae prevalence with their individual disability weights.4
Compiling the Results
The number of deaths in each age group was multiplied by the number of the remaining years of life (from the GBD standard life table) to estimate the years of life lost (YLL). The number of DALYs was estimated by summing YLDs and YLLs. The estimates were all standardized using the GBD standard population and included 95% UIs.4
Risk Factors
All risk factors with strong cancer causation evidence were included in the current research.14 Therefore, the proportion of DALYs attributable to the following risk factors were estimated: air pollution, high body mass index (BMI), high fasting plasma glucose, tobacco smoking, drinking alcohol, poor diet, drug use, low physical activity, unsafe sex, occupational risks, and other environmental risks. These risk factors have previously been reported, along with their relative risks.14
Results
National Level
In 2019, there were 381.4 thousand (95% UI: 270.5-525.7) incident cases of cancer among those aged 70 and older, with an age-standardized incidence rate of 10 985.6 (7,790.1-15,141.4) per 100 000 population, which has not substantially changed since 1990. In 2019, 29.6 thousand (26.8-32.2) deaths occurred due to cancers, with an age-standardized death rate of 853.2 (772.2-926.4) per 100 000 population, which was 13.8% (2.2-38.0) higher than in 1990. Cancers accounted for 412.9 thousand (378.2-445.4) DALYs in 2019, with an age-standardized DALY rate of 11,892.5 (10 894.5-12 829.3) per 100 000 population. The DALY rate of cancers was similar to that found in 1990 (Table 1).
Table 1.
Incident Cases, Deaths, and DALYs Due to Cancers Among Adults Aged 70 Years and Above in 1990 and 2019 and the Percentage Change in Rates Per 100 000 in Iran
|
|
Incidence (95% UI)
|
Deaths (95% UI)
|
DALYs (95% UI)
|
|
|
Counts
(2019)
|
Rate
(2019)
|
Pcs in Rate
1990-2019
|
Counts
(2019)
|
Rate
(2019)
|
Pcs in Rate
1990-2019
|
Counts
(2019)
|
Rate
(2019)
|
Pcs in Rate
1990-2019
|
| Iran |
381413
(270466, 525698) |
10985.6
(7790.1, 15141.4) |
-4.4
(-13.2, 7.4) |
29623
(26811, 32163) |
853.2
(772.2, 926.4) |
13.8
(2.2, 38) |
412899
(378249, 445424) |
11892.5
(10894.5, 12829.3) |
-0.1
(-9.6, 21.8) |
| Alborz |
12412
(8831, 17164) |
11465.1
(8157.1, 15853.9) |
1.5
(-5.4, 10.2) |
890
(768, 1025) |
821.9
(709.4, 946.6) |
9.4
(-12.9, 47.1) |
13077
(11322, 15067) |
12079
(10458.3, 13917.6) |
4.5
(-17.2, 41.7) |
| Ardebil |
6341
(4563, 8688) |
11256.2
(8099.5, 15422.7) |
-5
(-13, 5) |
687
(594, 771) |
1219.2
(1054.8, 1368.1) |
18.8
(-1.5, 53.2) |
9715
(8424, 10966) |
17246.2
(14954.1, 19465.9) |
8.3
(-11, 40.5) |
| Bushehr |
4121
(2893, 5709) |
11163.8
(7838.5, 15466.4) |
-1.5
(-8.3, 7.5) |
303
(269, 341) |
820.8
(728.8, 922.8) |
18.8
(-2, 49.6) |
4513
(4033, 5088) |
12226.1
(10925.8, 13784.4) |
12
(-7.5, 43.5) |
| Chahar Mahaal and Bakhtiari |
4006
(2857, 5518) |
10636.2
(7586.1, 14648.7) |
-8
(-17.9, 4.5) |
288
(247, 342) |
765
(656, 906.8) |
2.4
(-17.6, 31) |
3873
(3342, 4553) |
10282.2
(8872.2, 12087.9) |
-13.4
(-30.7, 12.1) |
| East Azarbayejan |
21107
(15029, 29103) |
11417.4
(8129.3, 15742.5) |
-4.3
(-13.4, 7.2) |
2241
(1923, 2570) |
1212.3
(1040.2, 1390.2) |
27.3
(2.4, 68.2) |
31647
(27219, 36355) |
17118.4
(14723.3, 19665.1) |
15.7
(-7.5, 53.7) |
| Fars |
21812
(15507, 30073) |
10920.5
(7763.9, 15056.1) |
-3.4
(-12, 7.8) |
1486
(1270, 1724) |
744.1
(635.9, 863.4) |
22.1
(-3.5, 59.6) |
20347
(17513, 23590) |
10186.7
(8767.8, 11810.3) |
4.5
(-17.1, 38.7) |
| Gilan |
17108
(12200, 23545) |
10969
(7822.4, 15096.3) |
-2.5
(-13.1, 11.9) |
1346
(1170, 1530) |
863
(750.4, 981.3) |
19.9
(-3.2, 52.1) |
18959
(16595, 21537) |
12155.9
(10640.4, 13809) |
2.7
(-16.6, 29.9) |
| Golestan |
6689
(4739, 9274) |
10894.2
(7717.8, 15103.2) |
-5.6
(-13.4, 4.9) |
530
(472, 592) |
863.4
(769.1, 964.4) |
7.5
(-11.3, 34.6) |
7655
(6856, 8572) |
12467.5
(11165.8, 13959.8) |
-3.7
(-20.3, 23.1) |
| Hamadan |
10162
(7216, 14015) |
10760.3
(7640.7, 14839.6) |
-8.5
(-18.5, 5.4) |
739
(630, 843) |
782.1
(666.9, 892.4) |
19.3
(-4.7, 53.8) |
10233
(8786, 11624) |
10835.7
(9303, 12308.4) |
0.4
(-19.7, 30.3) |
| Hormozgan |
5309
(3755, 7398) |
10560.2
(7468.9, 14716.8) |
-5.8
(-13.3, 4.2) |
278
(240, 322) |
552.2
(477, 640.7) |
7.1
(-11.8, 43.9) |
3882
(3393, 4456) |
7723.1
(6748.7, 8864.6) |
-6.5
(-23, 26.1) |
| Ilam |
2094
(1486, 2883) |
11224.9
(7965.7, 15453.6) |
-3.1
(-10.5, 5.2) |
186
(160, 210) |
997.3
(858.4, 1125.6) |
11.3
(-8, 38.4) |
2542
(2192, 2860) |
13627.1
(11750.4, 15330.6) |
2.5
(-15, 28.7) |
| Isfahan |
27766
(19745, 38249) |
11000.3
(7822.4, 15153.5) |
-2.3
(-12.4, 11.2) |
2080
(1771, 2405) |
824.1
(701.6, 952.9) |
38.3
(9.6, 87.6) |
28637
(24516, 33165) |
11345.4
(9712.7, 13139.1) |
20.2
(-5.4, 64.6) |
| Kerman |
11887
(8422, 16380) |
10733.6
(7605.4, 14790.9) |
-7.2
(-17.9, 6.7) |
850
(739, 957) |
767.6
(667.5, 864.5) |
11.8
(-8.9, 42.8) |
11501
(10000, 12967) |
10385.4
(9029.7, 11709.4) |
-7.7
(-25.4, 18.1) |
| Kermanshah |
9376
(6701, 12965) |
10917.3
(7803.1, 15096.5) |
-8.1
(-16.3, 2.4) |
734
(634, 846) |
854.9
(737.9, 985) |
1.3
(-17.9, 32) |
10126
(8774, 11631) |
11791.3
(10216.9, 13543.4) |
-11.9
(-29.2, 16.5) |
| Khorasan-e-Razavi |
29217
(20712, 40200) |
11054.2
(7836.5, 15209.5) |
-7.1
(-16.6, 5.2) |
2641
(2299, 3010) |
999.2
(869.7, 1138.9) |
11.7
(-7.8, 46.1) |
37513
(32823, 42595) |
14193.2
(12418.5, 16115.8) |
-4
(-21.5, 25.7) |
| Khuzestan |
17218
(12144, 23871) |
10694.4
(7542.6, 14826.2) |
-2.6
(-9.4, 6.1) |
1109
(976, 1262) |
689
(606.3, 783.6) |
18
(-2.9, 47.3) |
15562
(13755, 17699) |
9665.3
(8543.3, 10993.1) |
5.4
(-14.2, 32.7) |
| Kohgiluyeh and Boyer-Ahmad |
2379
(1697, 3267) |
11176.6
(7970.1, 15347.1) |
1
(-8.6, 13.6) |
178
(146, 209) |
834.3
(688, 981.5) |
20.1
(-7.2, 58.5) |
2325
(1929, 2751) |
10921
(9062.7, 12922.8) |
3.8
(-19.5, 38.2) |
| Kurdistan |
7556
(5405, 10426) |
11122.7
(7956.2, 15347.3) |
-7.3
(-14.3, 1.3) |
673
(570, 764) |
990
(838.7, 1124.3) |
-10.2
(-25.9, 12.1) |
9300
(7955, 10540) |
13689.8
(11710.4, 15515.8) |
-19.7
(-34.6, 1) |
| Lorestan |
8099
(5812, 11129) |
11099.6
(7965.4, 15252) |
-4.7
(-12.7, 5.8) |
703
(601, 813) |
964
(823.3, 1114.7) |
10
(-11.2, 42) |
9878
(8475, 11353) |
13537.9
(11614.5, 15559.4) |
-2.1
(-21.5, 29.1) |
| Markazi |
8923
(6390, 12238) |
10644.6
(7622.8, 14599.7) |
-8.4
(-18.9, 5) |
695
(590, 798) |
828.9
(703.9, 951.9) |
4.7
(-14.3, 30.4) |
9165
(7796, 10545) |
10933.8
(9300.7, 12579.7) |
-13
(-29.1, 9.4) |
| Mazandaran |
19390
(13826, 26721) |
11026.2
(7861.9, 15195.3) |
-4
(-13.3, 8.7) |
1542
(1322, 1772) |
877
(751.9, 1007.8) |
24.4
(0.3, 60.1) |
21528
(18573, 24715) |
12241.8
(10561.6, 14054.5) |
7.7
(-13.3, 38.6) |
| North Khorasan |
3920
(2792, 5399) |
11099.3
(7907, 15287.8) |
-6.8
(-16.3, 6.3) |
329
(288, 369) |
931.6
(815.8, 1046.2) |
8
(-11.5, 38.6) |
4677
(4096, 5221) |
13243
(11599, 14783) |
-7.7
(-24.3, 18.6) |
| Qazvin |
5975
(4230, 8270) |
10989.9
(7781.6, 15212.9) |
-5.1
(-14.7, 7.8) |
501
(427, 570) |
921.6
(786.2, 1049.2) |
33.7
(5.6, 72.7) |
7105
(6086, 8126) |
13068.4
(11194.5, 14947) |
15.9
(-7.6, 50.9) |
| Qom |
5362
(3825, 7364) |
11233.6
(8013.2, 15429.3) |
-2.4
(-10.9, 9.1) |
437
(375, 499) |
916.1
(784.6, 1046.4) |
5.8
(-14.8, 41.2) |
6037
(5203, 6868) |
12648.6
(10900.1, 14389.8) |
-7.7
(-25.5, 24.5) |
| Semnan |
3728
(2639, 5137) |
11028.7
(7807, 15196.3) |
-4.4
(-13.9, 7.4) |
306
(265, 350) |
905.4
(785, 1035.2) |
17.3
(-5.3, 52.8) |
4356
(3781, 5024) |
12885.5
(11185.7, 14862.3) |
1.1
(-18.4, 34.2) |
| Sistan and Baluchistan |
6070
(4275, 8406) |
10675.9
(7519.4, 14784.3) |
-9.5
(-18.3, 1.8) |
388
(324, 457) |
683.2
(569.2, 803.9) |
15.2
(-8.8, 50.8) |
5413
(4559, 6353) |
9521.3
(8018.2, 11174.2) |
-1.7
(-23, 31.8) |
| South Khorasan |
4338
(3080, 5958) |
10802
(7670.3, 14836.8) |
-7.4
(-17.1, 5.6) |
350
(301, 395) |
872.1
(748.6, 984) |
14.3
(-6.4, 43.2) |
4715
(4080, 5309) |
11741.6
(10160.3, 13220.7) |
-4.5
(-21.5, 21) |
| Tehran |
74860
(53182, 103758) |
10934.4
(7768.1, 15155.4) |
-1.6
(-9.5, 8.6) |
4788
(3998, 5535) |
699.3
(584, 808.5) |
1.7
(-19.1, 29.7) |
66030
(55851, 75940) |
9644.7
(8157.9, 11092.2) |
-7.3
(-26.9, 18.9) |
| West Azarbayejan |
13342
(9567, 18324) |
11219.4
(8045, 15409.3) |
-6.8
(-15.3, 3.9) |
1460
(1268, 1650) |
1227.9
(1066.6, 1387.7) |
10.8
(-7.7, 40.5) |
20366
(17751, 22950) |
17125.8
(14926.9, 19299.1) |
-0.9
(-18.3, 26.3) |
| Yazd |
5153
(3695, 7045) |
10995.4
(7884.4, 15031.1) |
-1.3
(-11.6, 12.6) |
431
(363, 502) |
919.7
(774.1, 1070.9) |
35.5
(8.4, 74.5) |
5866
(4951, 6818) |
12516.6
(10562.8, 14547.5) |
14.1
(-9.1, 48.9) |
| Zanjan |
5693
(4034, 7855) |
10830.4
(7674.5, 14943.7) |
-6.9
(-16.8, 6.5) |
453
(398, 507) |
862.2
(756.4, 965.1) |
20.1
(-3.3, 48.7) |
6355
(5612, 7086) |
12090.1
(10676.3, 13481.7) |
2.4
(-17.8, 28.9) |
Note. UI: Uncertainty interval; DALY: Disability-adjusted life-year; Pcs: Percent changes.
Provincial Level
Alborz [11 465.1 (8157.1-15 853.9)], East Azarbayejan [11,417.4 (8129.3-15 742.5)], and Ardebil [11256.2 (8099.5-15 422.7)] provinces had the highest age-standardized incidence rates of cancers in 2019. Conversely, the lowest rates were in Hormozgan [10 560.2 (7468.9-14 716.8)], Chahar Mahaal and Bakhtiari [10 636.2 (7586.1-14 648.7)], and Markazi [10 644.6 (7622.8-14 599.7)] provinces (Figure 1A and Table S2). Figures S1-S3 illustrate the sex-specific estimates for the age-standardized incidence rates of cancers among adults aged 70 and older at the provincial level.
West Azarbayejan [1227.9 (1066.6-1387.7)], Ardebil [1219.2 (1054.8-1368.1)], and East Azarbayejan [1212.3 (1040.2-1390.2)] had the highest age-standardized death rates in 2019. In comparison, Hormozgan [552.2 (477.0-640.7)], Sistan and Baluchistan [683.2 (569.2-803.9)], and Khuzestan [689 (606.3-783.6)] had the lowest rates (Figure 1B and Table S3). Figures S4-S6 illustrate the sex-specific estimates for the age-standardized death rates of cancers at the provincial level.
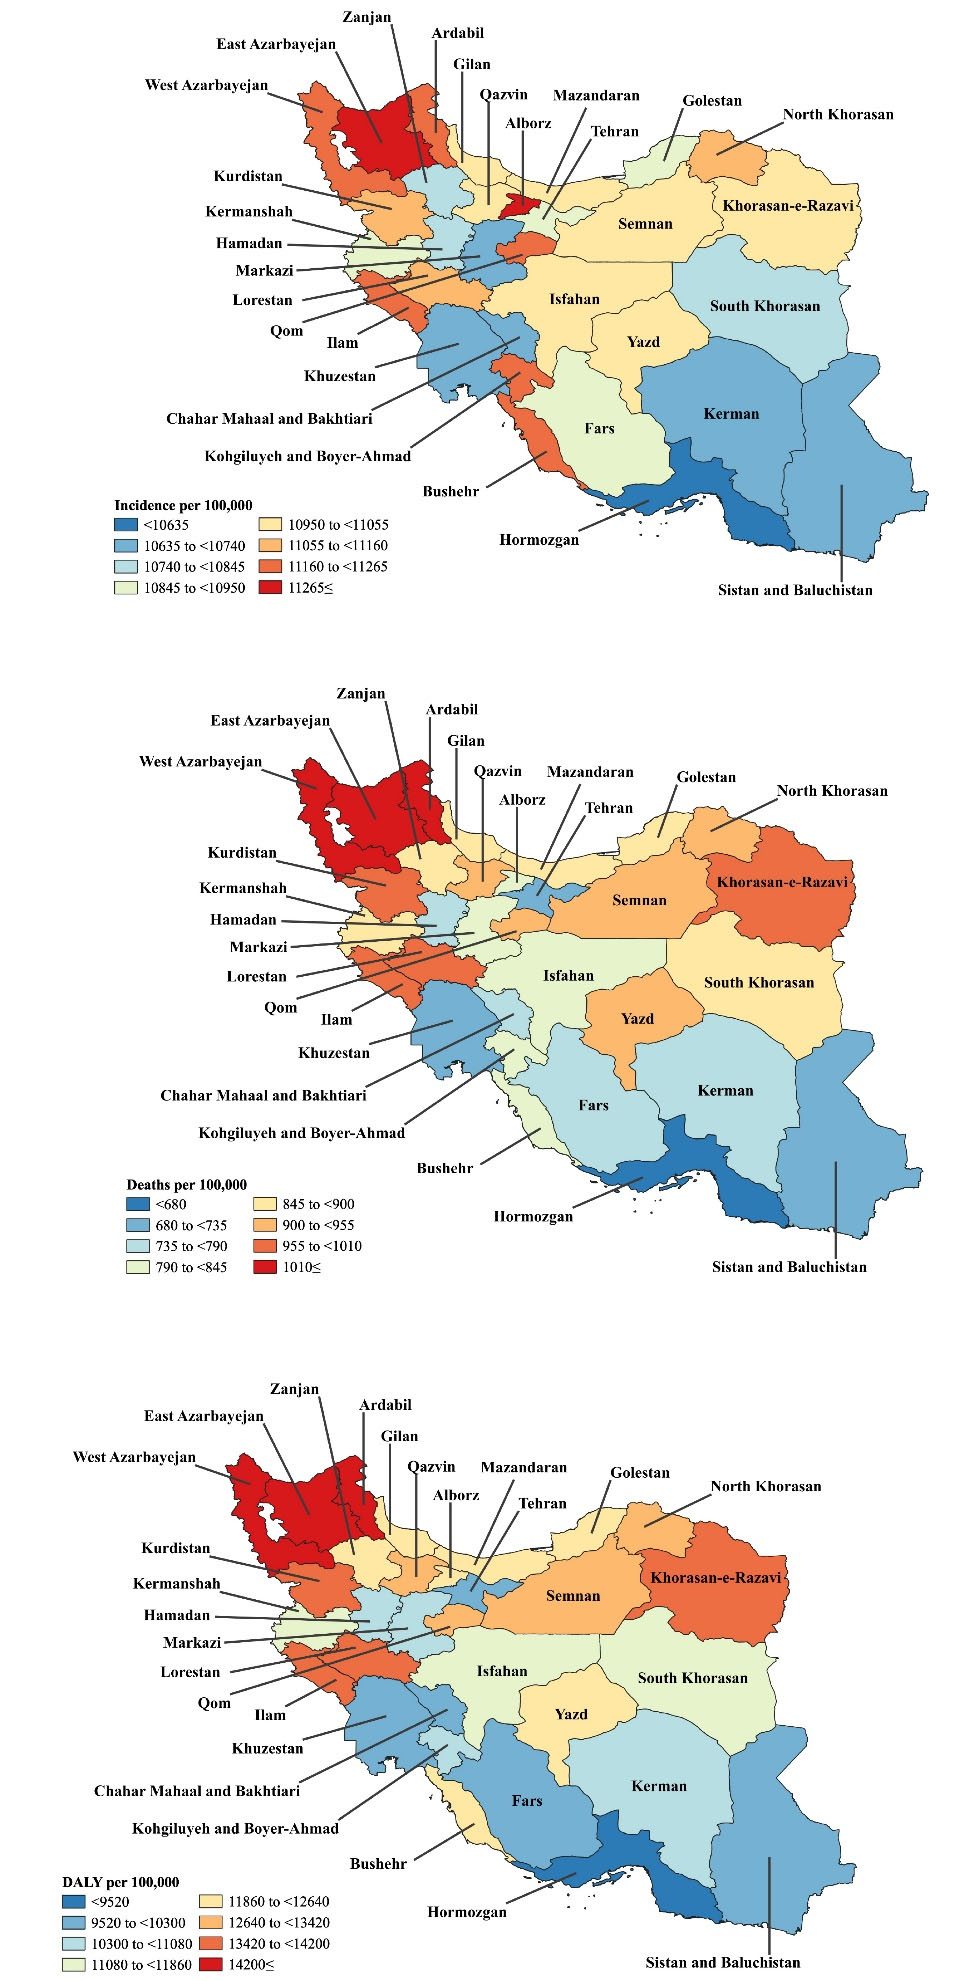
Figure 1.
Map of Incidence (A), Deaths (B), and DALY (C) Rates for Cancers (per 100,000 Population) Among Adults Aged 70 Years and Above in Iran in 2019. Note. DALY: Disability-adjusted-life-years. Source. Generated from data available on http://ghdx.healthdata.org/gbd-results-tool.
.
Map of Incidence (A), Deaths (B), and DALY (C) Rates for Cancers (per 100,000 Population) Among Adults Aged 70 Years and Above in Iran in 2019. Note. DALY: Disability-adjusted-life-years. Source. Generated from data available on http://ghdx.healthdata.org/gbd-results-tool.
Ardebil [17 246.2 (14 954.1-19 465.9)], West Azarbayejan [17 125.8 (14 926.9-19 299.1)], and East Azarbayejan [17 118.4 (14 723.3-19 665.1)] had the highest age-standardized DALY rates of cancers in 2019. In contrast, the lowest rates were found in Hormozgan [7723.1 (6748.7-8864.6)], Sistan and Baluchistan [9521.3 (8018.2-11 174.2)] and Tehran [9644.7 (8157.9-11 092.2)] (Figure 1C and Table S4). Figures S7-S9 illustrate the age-standardized DALY rates of cancers among adults aged 70 and above, by sex, at the provincial level.
The age-standardized death rate of cancers among adults aged 70 or older increased from 1990 to 2019 in Isfahan [38.3% (9.6-87.6)], Yazd [35.5% (8.4-74.5)], Qazvin [33.7% (5.6-72.7)], East Azarbayejan [27.3% (2.4-68.2)] and Mazandaran [24.4% (0.3-60.1)]. However, the age-standardized death rate did not decrease in any province. There were no substantial changes at the provincial level for the age-standardized incidence and DALY rates of cancers among adults aged 70 and older. The sex-specific estimates for the changes in the age-standardized incidence, death, and DALY rate of cancers (from 1990 to 2019) are presented at the provincial level in Tables S2-S4 and Figures S10-S12.
Age and Sex Patterns
In 2019, there were no large sex differences in the incident cases and age-standardized incidence rates of cancers in the geriatric population of Iran. The highest number of incident cases was found in the 70-74 age group, which decreased with advancing age. Furthermore, the age-standardized incidence rate followed a decreasing trend up to the 90-94 age group for males and the 85-89 age group for females, and then increased for the remaining age group(s), the details of which are depicted in Figure 2A.
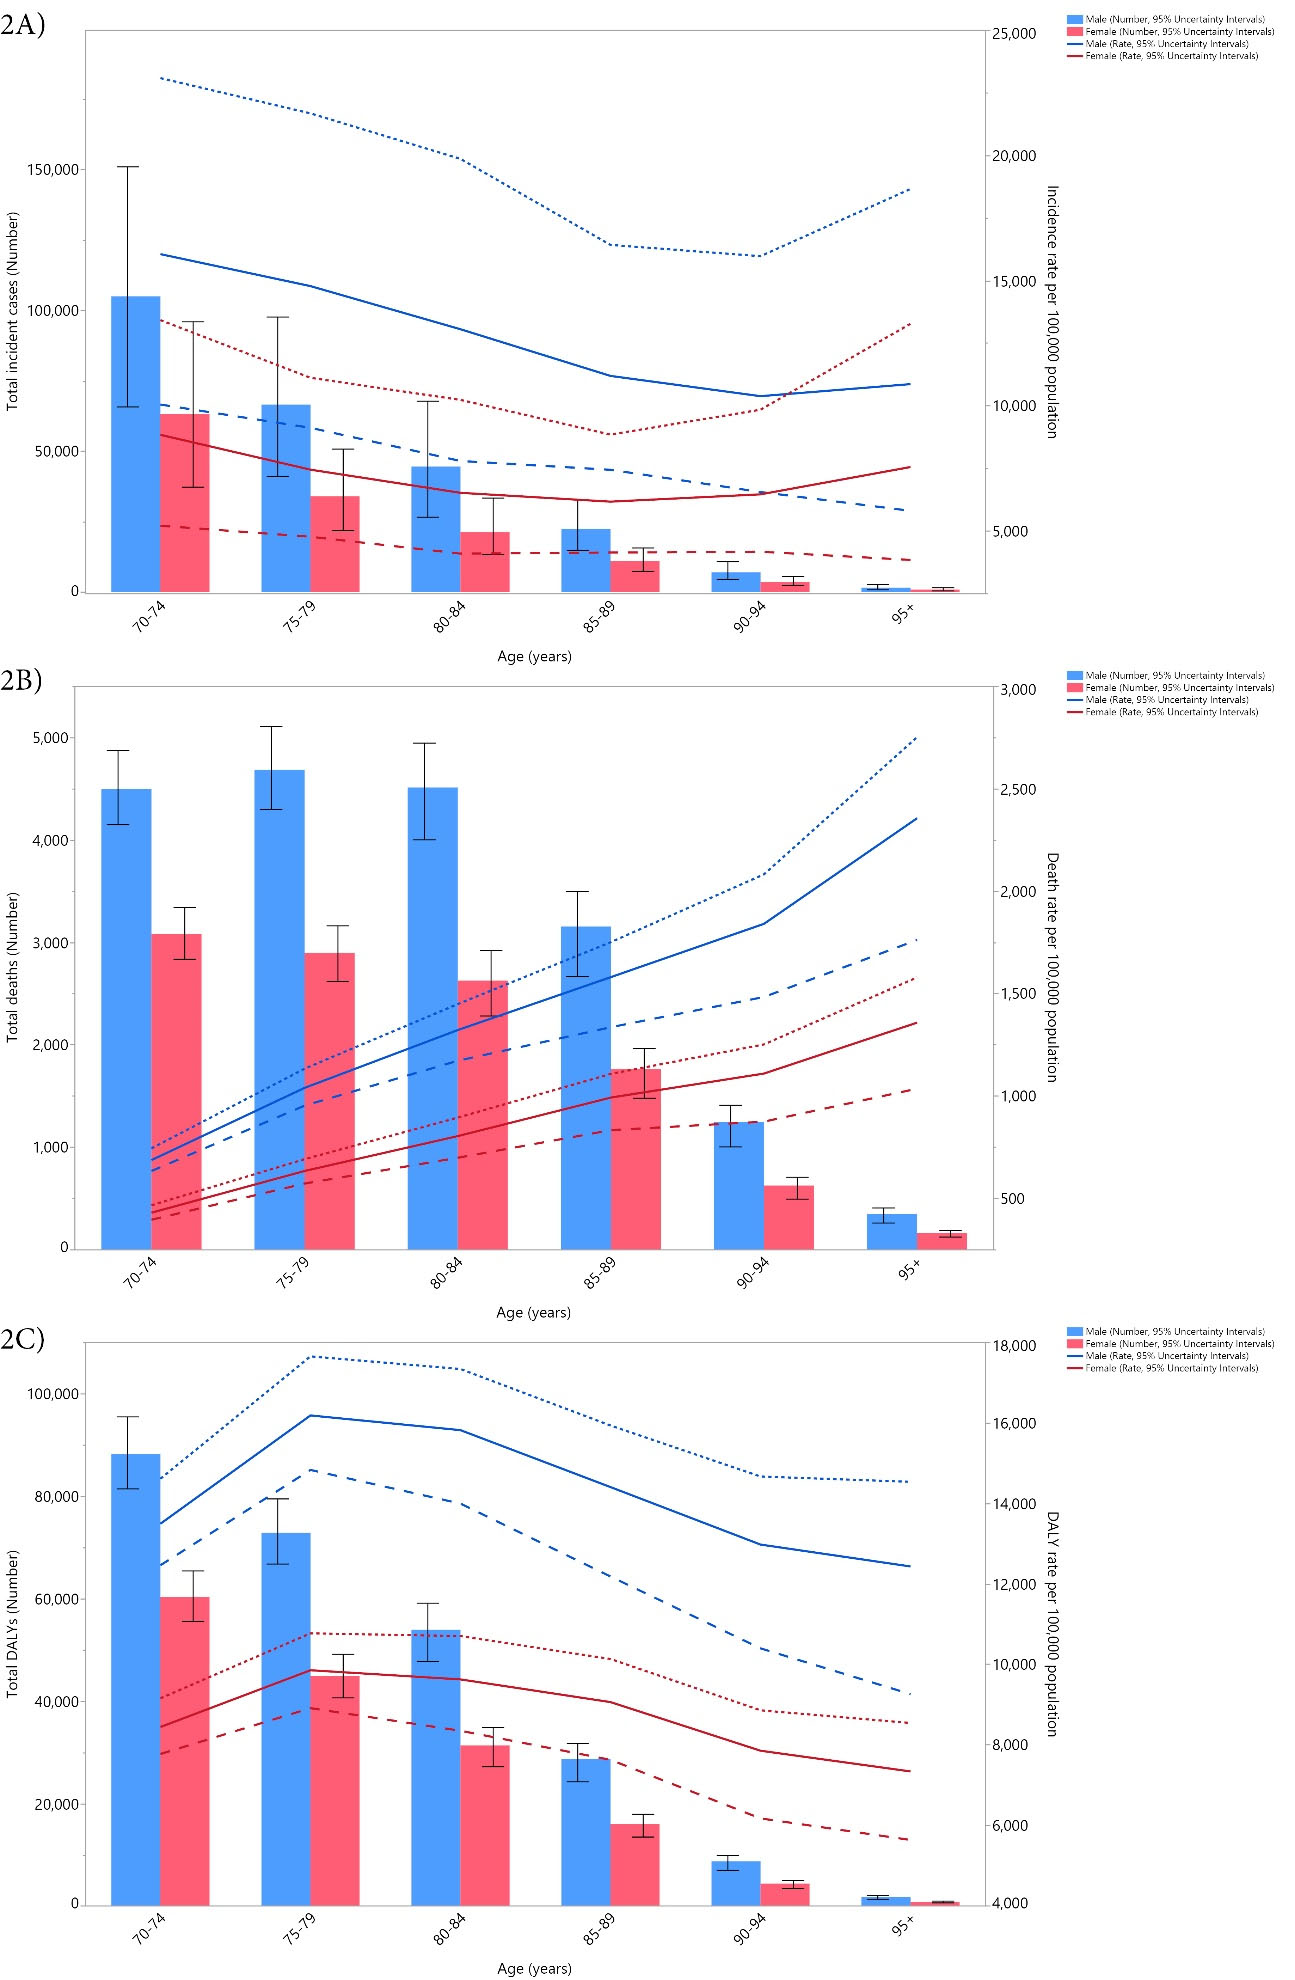
Figure 2.
Number of Incident Cases and Incidence Rate: (A) Number of Death Cases and (B) Death Rate and the Number of DALYs and DALY Rate (C) for Cancers (per 100 000 Population) Among Adults Aged 70 Years and Above in Iran in 2019 by Age and Sex. Note. Dotted and dashed lines indicate 95% upper and lower uncertainty intervals, respectively. DALY: Disability-adjusted life years. Source. Generated from data available on http://ghdx.healthdata.org/gbd-results-tool.
.
Number of Incident Cases and Incidence Rate: (A) Number of Death Cases and (B) Death Rate and the Number of DALYs and DALY Rate (C) for Cancers (per 100 000 Population) Among Adults Aged 70 Years and Above in Iran in 2019 by Age and Sex. Note. Dotted and dashed lines indicate 95% upper and lower uncertainty intervals, respectively. DALY: Disability-adjusted life years. Source. Generated from data available on http://ghdx.healthdata.org/gbd-results-tool.
In 2019, males had a higher number of deaths and age-standardized death rate than did females. The number of deaths among males increased from the first age group (70-74 years old) until the second (75-79 years old) and then decreased with advancing age, while in females, there was a constant decrease with advancing age. In contrast, for both sexes the age-standardized death rates from cancer increased with increasing age (Figure 2B).
In 2019, the number of DALYs and the age-standardized DALY rate of cancers in males were substantially higher than in females. The number of DALYs decreased for both sexes with increasing age. Furthermore, the age-standardized DALY rate of cancers was the highest in the 75-79 age group for both males and females, and then declined with age (Figure 2C).
Risk Factors
The proportion of DALYs attributable to each risk factor differed at the national and provincial levels. Nationally, tobacco smoking (18.0%), high BMI (5.1%), high fasting plasma glucose (5.0%), and dietary risks (5.0%) had the four largest attributable DALYs. Similar trends in the attributable DALYs were found in each province, and the highest and lowest DALYs (due to tobacco consumption) were found in Bushehr (21.5%) and Tehran (15.8%), respectively (Figure 3). The proportion of DALYs due to each cancer risk factor in each province is displayed, by sex, in Figures S13 and S14.
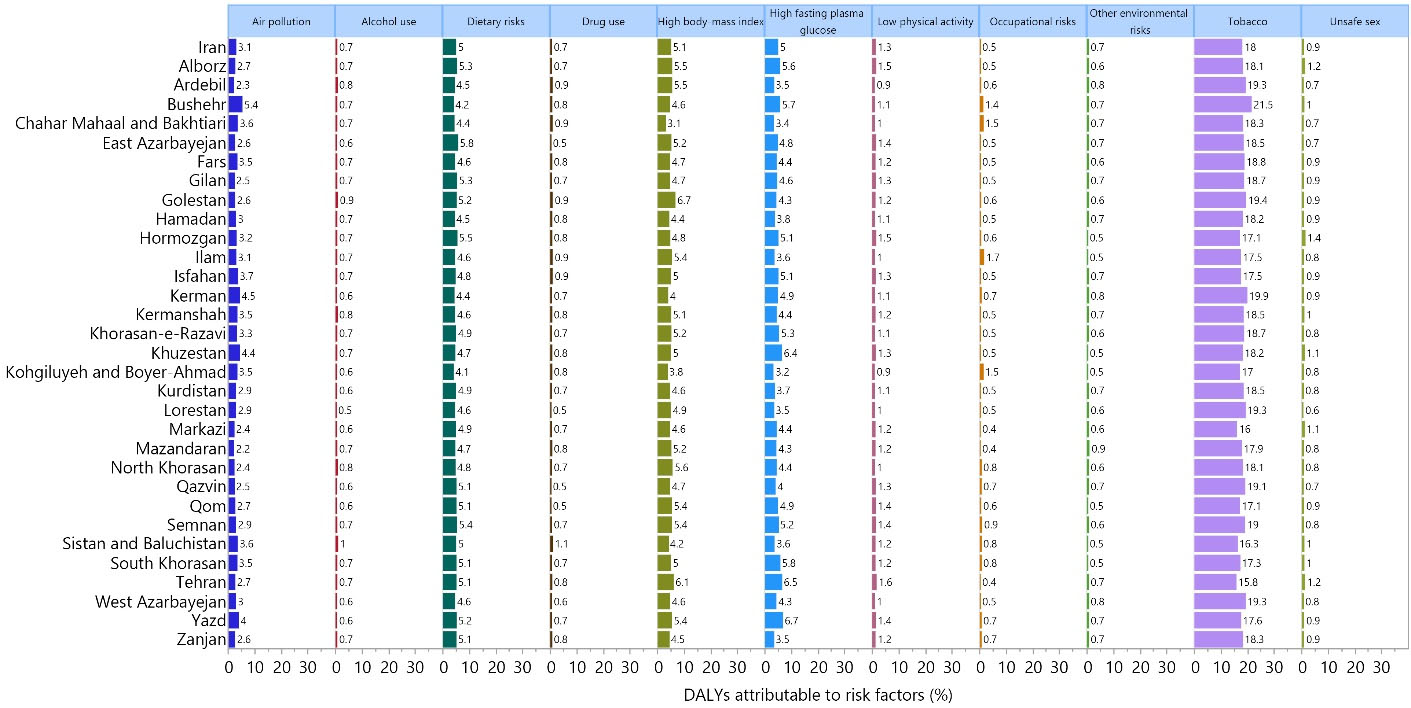
Figure 3.
Percentage of DALYs due to Cancers Attributable to Each Risk Factor Among Adults Aged 70 Years and Above in Iran in 2019. Note. DALY: Disability-adjusted life-year. Source. Generated from data available on http://ghdx.healthdata.org/gbd-results-tool.
.
Percentage of DALYs due to Cancers Attributable to Each Risk Factor Among Adults Aged 70 Years and Above in Iran in 2019. Note. DALY: Disability-adjusted life-year. Source. Generated from data available on http://ghdx.healthdata.org/gbd-results-tool.
Cancer Types
In 2019, other neoplasms, stomach and prostate cancers had the highest incidence rates among those aged 70 and older in Iran. In terms of death rates, stomach, tracheal, bronchus and lung, and prostate cancers had the three highest rates. Furthermore, stomach cancer, tracheal, bronchus, and lung cancer, and colon and rectum cancer had the highest DALY rates (Table S5).
Testicular, pancreatic, and ovarian cancers had the largest incidence rate increase from 1990 to 2019, while stomach cancer was the only cancer that decreased during this period. During the same measurement period, testicular, pancreatic, and ovarian cancers had the highest increase in the death rate, whereas nasopharynx and stomach cancers were the only types that decreased during this period. The highest increase in the DALY rate, during the measurement period, was found for testicular, pancreatic, and kidney cancers. In contrast, malignant skin melanoma, nasopharynx, and stomach cancers were the only types that had lower DALY rates in 2019 than in 1990 (Table S5).
Discussion
The current research presented the attributable burden of cancers among the elderly population of Iran. Based on our report, there were approximately 380 thousand new cancer cases in 2019, with nearly 30 thousand deaths among Iranians aged 70 and older. Moreover, the death rate attributable to cancers among the elderly increased by 13.8% over the past three decades, but the incidence rate did not change significantly. In 2019, Ardebil, West Azarbayejan, and East Azarbayejan provinces had the highest burdens of cancer, but none of them had changed substantially since 1990. In addition, males had a higher burden of cancer, and it increased constantly with advancing age. Furthermore, tobacco smoking, high BMI, high fasting plasma glucose, and dietary risks made the largest contributions to the burden of cancer among the elderly Iranian population. In terms of the cancer type, stomach, tracheal, bronchus, and lung, and colon and rectum cancers were responsible for the largest burden.
The incidence rate for the cancers among elderly Iranians (i.e., nearly 11 000 per 100 000 population) is substantially higher than that reported in 2015 (i.e., nearly 170 per 100 000 population) for the total Iranian population.15 In 2016, Khuzestan, Yazd, and Fars provinces had the highest incidence of cancer among the overall population of Iran,16 whereas this high rate, among older Iranians, belonged to Alborz, East Azarbayejan, and Ardebil provinces, highlighting the importance of developing cancer action plans based on the demographic feature of each province. In East Azarbayejan, it was found that the rate of cancer diagnosis in males and females was four and two times higher among the elderly, respectively, than they were among younger individuals. Likewise, in this province, the stomach (males) and esophagus (females) were the most common cancer sites.17 In addition, stomach cancer was the most frequently identified malignancy for both elderly males and females in Ardebil.18 Moreover, a 2012 study represented that the overall cancer mortality was 20% higher among Iranian males than among females,19 which is in line with our sample of older individuals. Furthermore, in 2019 the most deadliest cancer types for the general population of Iran were stomach cancer, tracheal, bronchus, and lung, and colon and rectum cancer.20 These findings are in accordance with the rankings we found among the elderly population of Iran, except for the third ranked cancer, which was prostate cancer.
A small number of studies have reported the attributable burden of cancer among the elderly. For instance, the cancer statistic project in the United States provided data on the burden of cancers for adults who were at least 85 years old based on the national registries.21 This indicated that while elderly adults (≥ 85 years old) comprised 2% of the US population in 2019, about 8% of all new cancer cases were diagnosed in this age group.21 In addition, the global cancer burden among the elderly (≥ 65 years old) was reported in 2012 using data provided by the GLOBOCAN project.22 The age-standardized incidence rates of cancers among the elderly population of the Middle East and North Africa (MENA) region, including Iran, were estimated to be 893 for males and 428 per 100 000 for females,22 which are extremely lower than our 2019 estimates. It is likely that any differences are as a result of differences in the methodologies of the GLOBOCAN and GBD projects. Nevertheless, it has been projected that by 2035, the number of new cases of cancer in the elderly will increase by 54% in developed countries and 144% in less developed countries, with the highest increase being in the MENA region.22
Concerning the age patterns, the findings of the present research revealed that the incidence rate decreased with age up to the 85-89 age group for females and the 90-94 age group for males, then it increased with advancing age. Conversely, a study in the US reported a steady upward trend in the incidence rate up to the 80-84 age group for females and the 85-89 age group for males, followed by a decrease.21 This disparity could be as a result of discrepancies in risk factor exposure. As a high-income county, controlling and preventing exposure to risk factors is relatively efficient in the US,23-25 while in Iran, there are few effective programs,7,26 implying that younger Iranian individuals are more commonly exposed to carcinogens. This may explain why the incidence of cancers peaks among young adults in Iran, while in the US, it peaks among older ages. Our results also demonstrated that tobacco smoking, high BMI, high fasting plasma glucose, and dietary risks were among the most common risk factors for cancers among Iranians aged 70 and above. Furthermore, using GBD data, a recent study reported that the DALY rates of cancer attributable to all risk factors (i.e., environmental, occupational, behavioral, and metabolic) peaked in older age groups.27 Despite a high burden of cancers attributable to risk factors among the elderly, the evidence suggests that smoking cessation at later ages may still be effective in reducing mortality from lung cancer28; sustained weight loss among older adults is related to a reduced risk of breast cancer29; further, glycemic control in older diabetic patients reduces the incidence of prostate cancer,30 and adherence to dietary recommendations lowers the occurrence of colorectal cancer in older individuals.31 Therefore, targeting people with effective interventions reducing exposure to modifiable cancer-related risk factors should be initiated early in life to reduce the burden of cancers. Moreover, cancer preventive programs should be expanded to target older people, aiming at reducing disabilities and deaths among the elderly.
The present study found that only stomach cancer had a decreasing incidence rate over the period 1990 to 2019. As infection-related cancer, this decline may reflect recent improvements in the treatment for Helicobacter pylori in Iran.32,33 The estimated trends for each cancer differ between countries, particularly according to socioeconomic status. For instance, in the United States, a sharp decline in the incidence rate of prostate and colorectal cancer was observed among the elderly during the same measurement period,21 which was largely due to the more common use of prostate-specific antigen testing and colonoscopy as screening measures in younger age groups.34 Furthermore, our results demonstrated that the most common cancers among elderly Iranian in 2019 were stomach and prostate cancers. Similarly, an investigation showed that the most common cancers among the elderly in the MENA region were prostate and breast cancers for males and females, respectively.22 Hence, despite the decrease in the incidence of stomach cancer, this type of cancer remains the main contributor to the burden of cancers among elderly Iranian. Thus, preventive strategies should be implemented, particularly in lower-income provinces with limited financial resources, and affordable cancer care services should be provided for the aging Iranian population.
The proportion of the population who are elderly will increase in coming years, which will place considerable additional strain on the health services and incur substantial societal and economic costs. Considering the epidemiologic and demographic transition theories, a stationary phase is expected to follow the expanding population phase.35 Due to improving life expectancy and decreasing the birth rate, it has been speculated that the Iranian population has already passed the expanding phase and is in the middle of the stationary phase.1,37 The stabilized phase provides healthcare policy-makers with a great opportunity to develop a comprehensive cancer control strategy for dealing with the growing number of elderly Iranians in order to better control the future burden of cancers.36,37 For this purpose, an effective and cost-effective cancer screening program will be required and should be routinely available for all at-risk individuals in order to reduce the incidence and subsequent disabilities and complications of malignancies among the elderly population in Iran.
Strengths and Limitations
To the best of our knowledge, the present research is the first one to report the burden of cancers among elderly Iranians. However, we acknowledge that several shortcomings may affect the interpretation of our findings. First, as with all GBD projects, the scarcity of data is the main limitation, particularly in developing countries where epidemiological estimates mostly rely on projections made via modeling. In addition, the death estimates might not be as accurate for older age groups since the accuracy of the death system registries depends on the information provided on death certificates. Considering that older people often suffer from several comorbidities at the same time, identifying the exact reason for death may be challenging. Finally, the probability of under-diagnosis is extremely higher among the elderly population, especially in locations where there is limited access to diagnostic facilities. Consequently, obtaining more precise and high-quality data for the next GBD iterations will improve the level of certainty and thereby evidence-based decision-making.
Conclusions
Despite the steady incidence rate of cancers among the older population, the mortality rate in Iran has risen over the past three decades. In addition to planning for preventive measures, novel treatment approaches should be tested among the elderly; this is because they are commonly excluded from cancer-related clinical trials, and less attention is paid to discovering tolerable therapeutic modalities for them. Thus, future research should evaluate the detailed needs of older cancer patients for improving cancer surveillance and revisiting geriatric cancer management strategies while taking into consideration the limited resources available in developing counties such as Iran.
Acknowledgments
We acknowledge the hard work of the Institute for Health Metrics and Evaluation staff, as well as their collaborators, who prepared these publicly available data. In addition, we also acknowledge the Social Determinants of Health Research Center at the Shahid Beheshti University of Medical Sciences, Tehran, Iran. This research used publicly available data and only reflects the opinions of its authors, not that of the Institute for Health Metrics and Evaluation.
Funding
The present study was funded by the Shahid Beheshti University of Medical Sciences, Tehran, Iran (Grant No. 43003945). Furthermore, the GBD project was funded by the Bill and Melinda Gates Foundation, who played no role in the preparation of this manuscript.
Data availability statement
The data used for these analyses are all publicly available.
Ethical approval
The Shahid Beheshti University of Medical Sciences, Tehran, Iran (Ethics code: IR.SBMU.RETECH.REC.1401.759) approved the present report.
Consent for publication
Not applicable.
Conflict of interests
The authors declare that the research was conducted in the absence of any commercial or financial relationships that could be construed as a potential conflict of interest.
Supplementary files
Supplementary file 1 contains Tables S1-S5 and Figures S1-S14.
(pdf)
References
- Danaei G, Farzadfar F, Kelishadi R, Rashidian A, Rouhani OM, Ahmadnia S. Iran in transition. Lancet 2019; 393(10184):1984-2005. doi: 10.1016/s0140-6736(18)33197-0 [Crossref] [ Google Scholar]
- Griffith A. The importance of clinical registries. J Public Health 2018; 41(3):648. doi: 10.1093/pubmed/fdy179 [Crossref] [ Google Scholar]
- Modirian M, Rahimzadeh S, Cheraghi Z, Khosravi A, Salimzadeh H, Kompani F. Quality evaluation of national cancer registry system in Iran: study protocol. Arch Iran Med 2014; 17(3):193-7. [ Google Scholar]
- Vos T, Lim SS, Abbafati C, Abbas KM, Abbasi M, Abbasifard M. Global burden of 369 diseases and injuries in 204 countries and territories, 1990-2019: a systematic analysis for the Global Burden of Disease Study 2019. Lancet 2020; 396(10258):1204-22. doi: 10.1016/s0140-6736(20)30925-9 [Crossref] [ Google Scholar]
- Kocarnik JM, Compton K, Dean FE, Fu W, Gaw BL, Harvey JD. Cancer incidence, mortality, years of life lost, years lived with disability, and disability-adjusted life years for 29 cancer groups from 2010 to 2019: a systematic analysis for the Global Burden of Disease Study 2019. JAMA Oncol 2022; 8(3):420-44. doi: 10.1001/jamaoncol.2021.6987 [Crossref] [ Google Scholar]
- Kolahdoozan S, Sadjadi A, Radmard AR, Khademi H. Five common cancers in Iran. Arch Iran Med 2010; 13(2):143-6. [ Google Scholar]
- Farzadfar F, Naghavi M, Sepanlou SG, Saeedi Moghaddam S, Dangel WJ, Davis Weaver N. Health system performance in Iran: a systematic analysis for the Global Burden of Disease Study 2019. Lancet 2022; 399(10335):1625-45. doi: 10.1016/s0140-6736(21)02751-3 [Crossref] [ Google Scholar]
- Sheidaei A, Gohari K, Kasaeian A, Rezaei N, Mansouri A, Khosravi A. National and subnational patterns of cause of death in Iran 1990-2015: applied methods. Arch Iran Med 2017; 20(1):2-11. [ Google Scholar]
- DePinho RA. The age of cancer. Nature 2000; 408(6809):248-54. doi: 10.1038/35041694 [Crossref] [ Google Scholar]
- Amori N, Aghajani M, Asgarian FS, Jazayeri M. Epidemiology and trend of common cancers in Iran (2004-2008). Eur J Cancer Care (Engl) 2017;26(5). 10.1111/ecc.12449.
- Roshandel G, Ghanbari-Motlagh A, Partovipour E, Salavati F, Hasanpour-Heidari S, Mohammadi G. Cancer incidence in Iran in 2014: results of the Iranian National Population-based Cancer Registry. Cancer Epidemiol 2019; 61:50-8. doi: 10.1016/j.canep.2019.05.009 [Crossref] [ Google Scholar]
- Mousavi SM, Gouya MM, Ramazani R, Davanlou M, Hajsadeghi N, Seddighi Z. Cancer incidence and mortality in Iran. Ann Oncol 2009; 20(3):556-63. doi: 10.1093/annonc/mdn642 [Crossref] [ Google Scholar]
- Abachizadeh K, Keramatinia A. Anticipating cancer rates of Iran in 2025. Commonity Health 2016; 3(1):66-73. [ Google Scholar]
- Murray CJL, Aravkin AY, Zheng P, Abbafati C, Abbas KM, Abbasi-Kangevari M. Global burden of 87 risk factors in 204 countries and territories, 1990-2019: a systematic analysis for the Global Burden of Disease Study 2019. Lancet 2020; 396(10258):1223-49. doi: 10.1016/s0140-6736(20)30752-2 [Crossref] [ Google Scholar]
- Alsharif U, El Bcheraoui C, Khalil I, Charara R, Moradi-Lakeh M, Afshin A. Burden of cancer in the Eastern Mediterranean Region, 2005-2015: findings from the Global Burden of Disease 2015 Study. Int J Public Health 2018; 63(Suppl 1):151-64. doi: 10.1007/s00038-017-0999-9 [Crossref] [ Google Scholar]
- Khanali J, Kolahi AA. National and subnational cancer incidence for 22 cancer groups, 2000 to 2016: a study based on cancer registration data of Iran. J Cancer Epidemiol 2021; 2021:6676666. doi: 10.1155/2021/6676666 [Crossref] [ Google Scholar]
- Somi MH, Mousavi SM, Rezaeifar P, Naghashi SH. Cancer incidence among the elderly population in the Northwest of Iran: a population based study. Iran J Cancer Prev 2009; 2(3):117-26. [ Google Scholar]
- Babaei M, Jaafarzadeh H, Sadjadi A, Samadi F, Yazdanbod A, Fallah M. Cancer incidence and mortality in Ardabil: report of an ongoing population-based cancer registry in Iran, 2004-2006. Iran J Public Health 2009; 38(4):35-45. [ Google Scholar]
- Mohebbi E, Nahvijou A, Hadji M, Rashidian H, Seyyedsalehi MS, Nemati S. Iran Cancer Statistics in 2012 and projection of cancer incidence by 2035. Basic Clin Cancer Res 2017; 9(3):3-22. [ Google Scholar]
- Lin L, Li Z, Yan L, Liu Y, Yang H, Li H. Global, regional, and national cancer incidence and death for 29 cancer groups in 2019 and trends analysis of the global cancer burden, 1990-2019. J Hematol Oncol 2021; 14(1):197. doi: 10.1186/s13045-021-01213-z [Crossref] [ Google Scholar]
- DeSantis CE, Miller KD, Dale W, Mohile SG, Cohen HJ, Leach CR. Cancer statistics for adults aged 85 years and older, 2019. CA Cancer J Clin 2019; 69(6):452-67. doi: 10.3322/caac.21577 [Crossref] [ Google Scholar]
- Pilleron S, Sarfati D, Janssen-Heijnen M, Vignat J, Ferlay J, Bray F. Global cancer incidence in older adults, 2012 and 2035: a population-based study. Int J Cancer 2019; 144(1):49-58. doi: 10.1002/ijc.31664 [Crossref] [ Google Scholar]
- Sorensen G, Stoddard AM, LaMontagne AD, Emmons K, Hunt MK, Youngstrom R. A comprehensive worksite cancer prevention intervention: behavior change results from a randomized controlled trial (United States). Cancer Causes Control 2002; 13(6):493-502. doi: 10.1023/a:1016385001695 [Crossref] [ Google Scholar]
- Abed J, Reilley B, Butler MO, Kean T, Wong F, Hohman K. Developing a framework for comprehensive cancer prevention and control in the United States: an initiative of the Centers for Disease Control and Prevention. J Public Health Manag Pract 2000; 6(2):67-78. doi: 10.1097/00124784-200006020-00011 [Crossref] [ Google Scholar]
- Tomeo CA, Colditz GA, Willett WC, Giovannucci E, Platz E, Rockhill B. Harvard Report on Cancer Prevention Volume 3: prevention of colon cancer in the United States. Cancer Causes Control 1999; 10(3):167-80. doi: 10.1023/a:1017117109568 [Crossref] [ Google Scholar]
- Mousavi SM, Alamolhoda AA, Gouya MM, Lickiss N. Implementation of Comprehensive National Cancer Control Program in Iran: an experience in a developing country. Ann Oncol 2008; 19(2):398-400. doi: 10.1093/annonc/mdm581 [Crossref] [ Google Scholar]
- Tran KB, Lang JJ, Compton K, Xu R, Acheson AR, Henrikson HJ. The global burden of cancer attributable to risk factors, 2010-19: a systematic analysis for the Global Burden of Disease Study 2019. Lancet 2022; 400(10352):563-91. doi: 10.1016/s0140-6736(22)01438-6 [Crossref] [ Google Scholar]
- Reitsma M, Kendrick P, Anderson J, Arian N, Feldman R, Gakidou E. Reexamining rates of decline in lung cancer risk after smoking cessation A meta-analysis. Ann Am Thorac Soc 2020; 17(9):1126-32. doi: 10.1513/AnnalsATS.201909-659OC [Crossref] [ Google Scholar]
- Teras LR, Patel AV, Wang M, Yaun SS, Anderson K, Brathwaite R. Sustained weight loss and risk of breast cancer in women 50 years and older: a pooled analysis of prospective data. J Natl Cancer Inst 2020; 112(9):929-37. doi: 10.1093/jnci/djz226 [Crossref] [ Google Scholar]
- Park J, Cho SY, Lee YJ, Lee SB, Son H, Jeong H. Poor glycemic control of diabetes mellitus is associated with higher risk of prostate cancer detection in a biopsy population. PLoS One 2014; 9(9):e104789. doi: 10.1371/journal.pone.0104789 [Crossref] [ Google Scholar]
- Cheng E, Um CY, Prizment AE, Lazovich D, Bostick RM. Evolutionary-concordance lifestyle and diet and Mediterranean diet pattern scores and risk of incident colorectal cancer in Iowa women. Cancer Epidemiol Biomarkers Prev 2018; 27(10):1195-202. doi: 10.1158/1055-9965.epi-17-1184 [Crossref] [ Google Scholar]
- Ashtari S, Pourhoseingholi MA, Molaei M, Taslimi H, Zali MR. The prevalence of Helicobacter pylori is decreasing in Iranian patients. Gastroenterol Hepatol Bed Bench 2015; 8(Suppl 1):S23-9. [ Google Scholar]
- Akbarpour E, Sadjadi A, Derakhshan MH, Roshandel G, Alimohammadian M. Gastric cancer in Iran: an overview of risk factors and preventive measures. Arch Iran Med 2021; 24(7):556-67. doi: 10.34172/aim.2021.79 [Crossref] [ Google Scholar]
- Smith RA, Andrews KS, Brooks D, Fedewa SA, Manassaram-Baptiste D, Saslow D. Cancer screening in the United States, 2019: a review of current American Cancer Society guidelines and current issues in cancer screening. CA Cancer J Clin 2019; 69(3):184-210. doi: 10.3322/caac.21557 [Crossref] [ Google Scholar]
- Chesnais JC. The Demographic Transition: Stages, Patterns, and Economic Implications. Oxford University Press; 1992.
- Naghavi M. Transition in health status in the Islamic Republic of Iran. Iran J Epidemiol 2006;2(1):45-57. [Persian].
- Peykari N, Hashemi H, Dinarvand R, Haji-Aghajani M, Malekzadeh R, Sadrolsadat A. National action plan for non-communicable diseases prevention and control in Iran; a response to emerging epidemic. J Diabetes Metab Disord 2017; 16:3. doi: 10.1186/s40200-017-0288-4 [Crossref] [ Google Scholar]